If you are a company or an individual who is integrating Google Lighthouse as part of the products/services you’re offering, first things first - we’re so excited you are! We want as many people as possible to use it, and these Guidelines and Brand Assets for Integrating Lighthouse are meant to make it straightforward for you to use this powerful toolkit.
It’s also a freeway that will show you that Lighthouse is committed under the hood while protecting both you and its brand. And since Lighthouse is open source, all contributions are welcome from all angles! As such, you can check out the repository’s issue tracker to find bugs that you can fix, or audits that you can create or improve upon.
The issues tracker is also a good place to discuss performance metrics, ideas for new audits, or anything else related to Lighthouse. But, all in all, wouldn’t it be nice if you could see your website through Google’s eyes? We all know the fine details of Google’s algorithm are a closely kept secret. At the same time, we have a lot of information that we can evaluate.
Such as the important aspects that Google deems useful when judging a website. What’s more, there’s a host of free tools that Google offers designed to help us improve our websites — and, as such, one such tool is Google Lighthouse.
What Is Google Lighthouse All About?
Google Lighthouse is a free tool that provides powerful insights to help improve your website. By generating a Lighthouse report, you can assess any web page’s page experience and access valuable tips to improve its performance. Given that: Google has recently increased emphasis on-page experience, including adding a new set of core web vitals key signals.
The signals break down how a user experiences your page, and you can see how your website performs in this area through Lighthouse. This means, that web optimization is no longer just about speed. Google has started the rollout of its new “page experience update,” designed to “highlight pages that offer great user experiences.”
Additionally, Google will use the results of its user experience report as a ranking factor. A quick Google search offers countless tools designed to analyze websites and provide feedback for enhancing and improving the user experience. Among these tools, you’ll find the ones developed and maintained by Google: PageSpeed Insights Tool and Google Lighthouse.
That said, you can check out the video below from Google I/O to learn more about how to use and contribute to Lighthouse:
Simply put, Google Lighthouse is a great, open-source tool to help analyze any website. It provides an audit report assessing the following metrics that, according to Google, are necessary for a great user experience.
They include:
- Speed Performance
- Website User Accessibility
- User Interface (UI) Design
- SEO (Search Engine Optimization)
- Progressive Web Apps (PWA)
- Plus All The Core Web Vitals
The best thing is that you can run it against any web page, public or requiring authentication. It has audits for performance, accessibility, progressive web apps, SEO, and more. Overall, the report helps identify a website’s weak areas.
It then provides feedback for applying the necessary changes. At first, the user experience update was initially mobile-only. But, during the 2021 Google I/O event, it announced that the update is also coming to desktops soon as well.
How Google Lighthouse Tool Usually Works
Essentially, as we aforementioned, one ranking factor we know is becoming more and more critical is the overall page experience and Google Lighthouse could be the tool you need to make sure your website is performing in this area and many more. Google Lighthouse is an open-source, automated tool for improving website speed performance.
As well as the content quality, and correctness of your overall website and application platforms. When auditing a page, it runs a barrage of tests against the page and then generates a report on how well the page did. From here you can use the failing tests as indicators of what you can do to improve. You can run Lighthouse in Chrome DevTools for your site.
In particular, from the command line, or as a Node module. You give Lighthouse a URL to audit, it runs a series of audits against the page, and then it generates a report on how well the page did. From there, use the failing audits as indicators of how to improve the page. Each audit has a reference doc explaining why the audit is important, as well as how to fix it.
Forthwith, you can also use Lighthouse CI to prevent regressions on your web-based business websites. Whereby, your build system will be running Lighthouse on your project’s URLs on every commit, automatically asserting that important Lighthouse audits pass, and uploading the reports for manual inspection. Thus, this is a very great toolkit for webmasters.
The Simple Steps To Get Started With Google Lighthouse
For your information, the Lighthouse CI provides added value to your Continuous Integration (CI) process. If you’re unfamiliar with continuous integration or haven’t set it up on a project before, we will try to define a few key concepts for you. And then again, we’ll also provide you with a few references on how to get started with various CI providers.
Fortunately, the next section will provide a step-by-step walkthrough on how to set up Lighthouse CI on your repository. And, after this, you’ll be able to build a system that will be running Lighthouse on your project’s URLs on every commit. Automatically, it allows you to assert those important Lighthouse audits pass and uploads the reports for manual inspection.
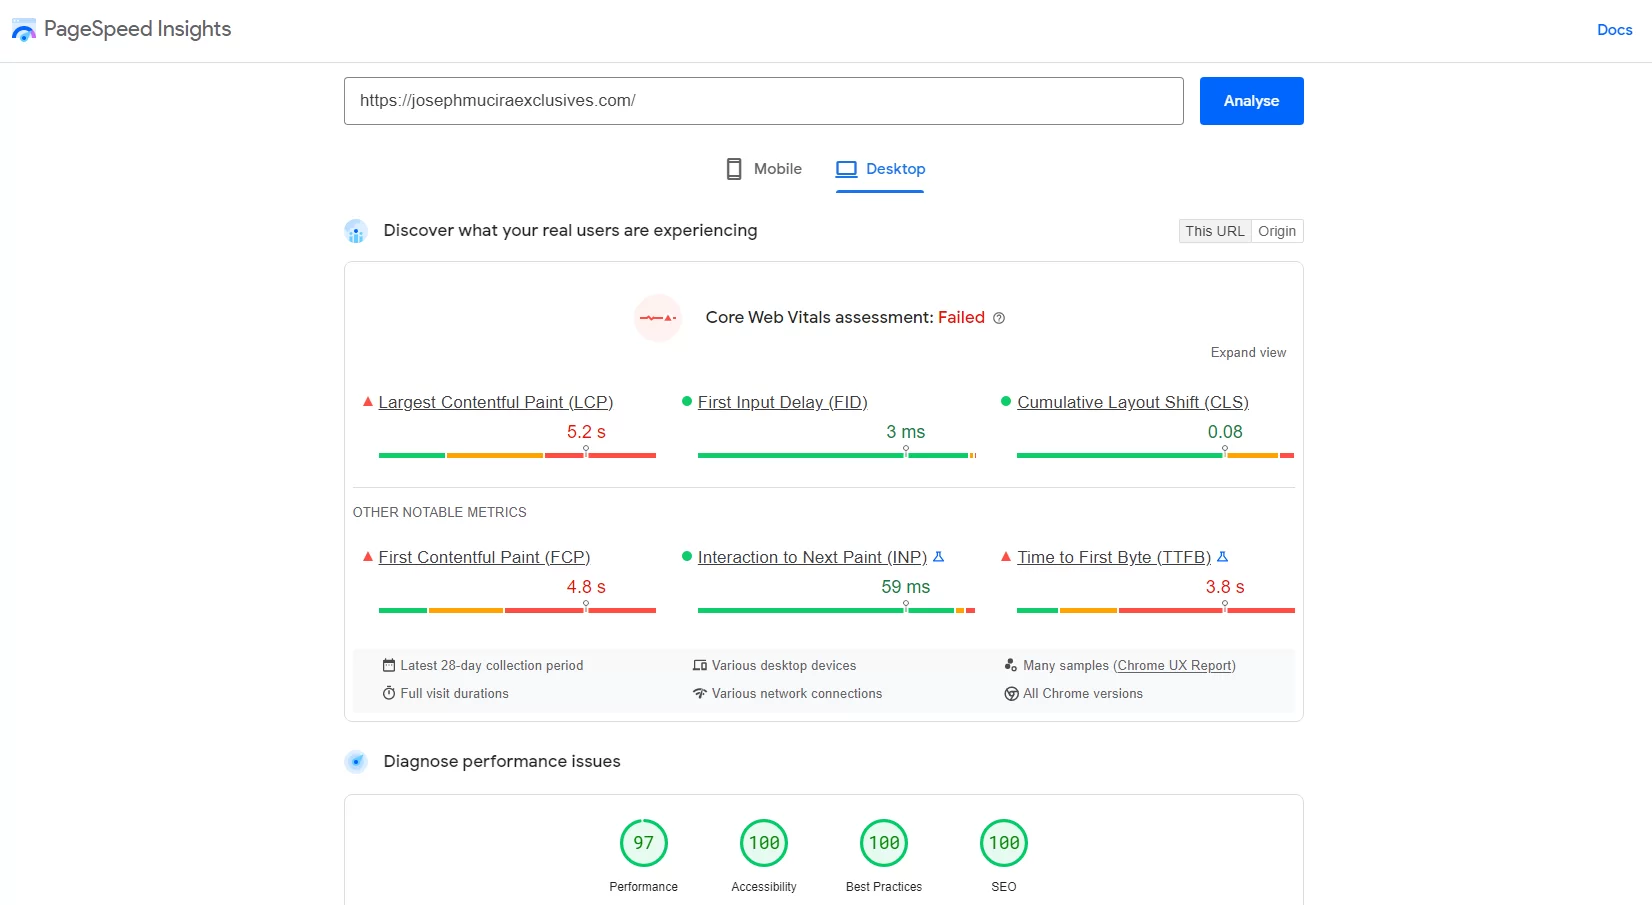
Perse, you can run Lighthouse in Chrome DevTools, from the command line, or as a Node module. Thus, to give you an idea of the Google Lighthouse PageSpeed Insights Tool in action, below are the real-time results for our website:
Our Google Lighthouse PageSpeed Insights Real-Time Mobile Test Results
Our Google Lighthouse PageSpeed Insights Real-Time Desktop Test Results
You give Lighthouse a URL to audit, it runs a series of audits against the page, and then it generates a report on how well the page did. From there, use the failing audits as indicators of how to improve the page — each audit has a reference doc.
The attached audit report reference document tries to explain why the audit is important, as well as how to fix it. Specifically, to get started, the first thing is to choose the Lighthouse workflow that best suits your web-based business needs.
The ways to utilize it:
- In Chrome DevTools: Easily audit pages that require authentication, and read your reports in a user-friendly format.
- From The Command Line: Automate your Lighthouse runs via shell scripts.
- As A Node Module: Integrate Lighthouse into your continuous integration systems.
- From A Web UI: Run Lighthouse and link to reports without installing a thing.
The CLI and Node workflows require you to have an instance of Google Chrome installed on your machine. It’s, important to realize, that the Google Lighthouse Tool has its own panel in Chrome DevTools to help you run the test head-on.
Step #1: Use The Chrome DevTools
To run a report:
- Download Google Chrome for Desktop.
- In Google Chrome, go to the URL you want to audit. You can audit any URL on the web.
- Open Chrome DevTools.
- Click the Lighthouse tab.
As you can see, to the left is the viewport of the page that will be audited. While, in the same fashion, to the right is the Lighthouse panel of Chrome DevTools, which is powered by Lighthouse that you can use to analyze and audit your site.
- Click the analyze page load tab: DevTools shows you a list of audit categories. Leave them all enabled.
- Click the run audit option: After 30 to 60 seconds, Lighthouse gives you a report on the page.
For example, the illustration above shows a Lighthouse report in Chrome DevTools.
Step #2: Install And Run The Node Module (Command Line Tool)
To Install The Node Module
- Download Google Chrome For Desktop
- Install the current Long-Term Support version of Node
- Install Lighthouse. The
-gflag installs it as a global module.
npm install -g lighthouseTo Run A Lighthouse Audit
lighthouse <url>To See All Other Options
lighthouse --helpBy the same token, you can also run the Node Module Programmatically in your setup configuration. Luckily, you can first see a full guide about using programmatically for an example of running Lighthouse programmatically, specifically, as a Node module in this case. Suffice it to say, it’s very simple and easy to run Google Lighthouse on PageSpeed Insights too.
Consider the following simple steps:
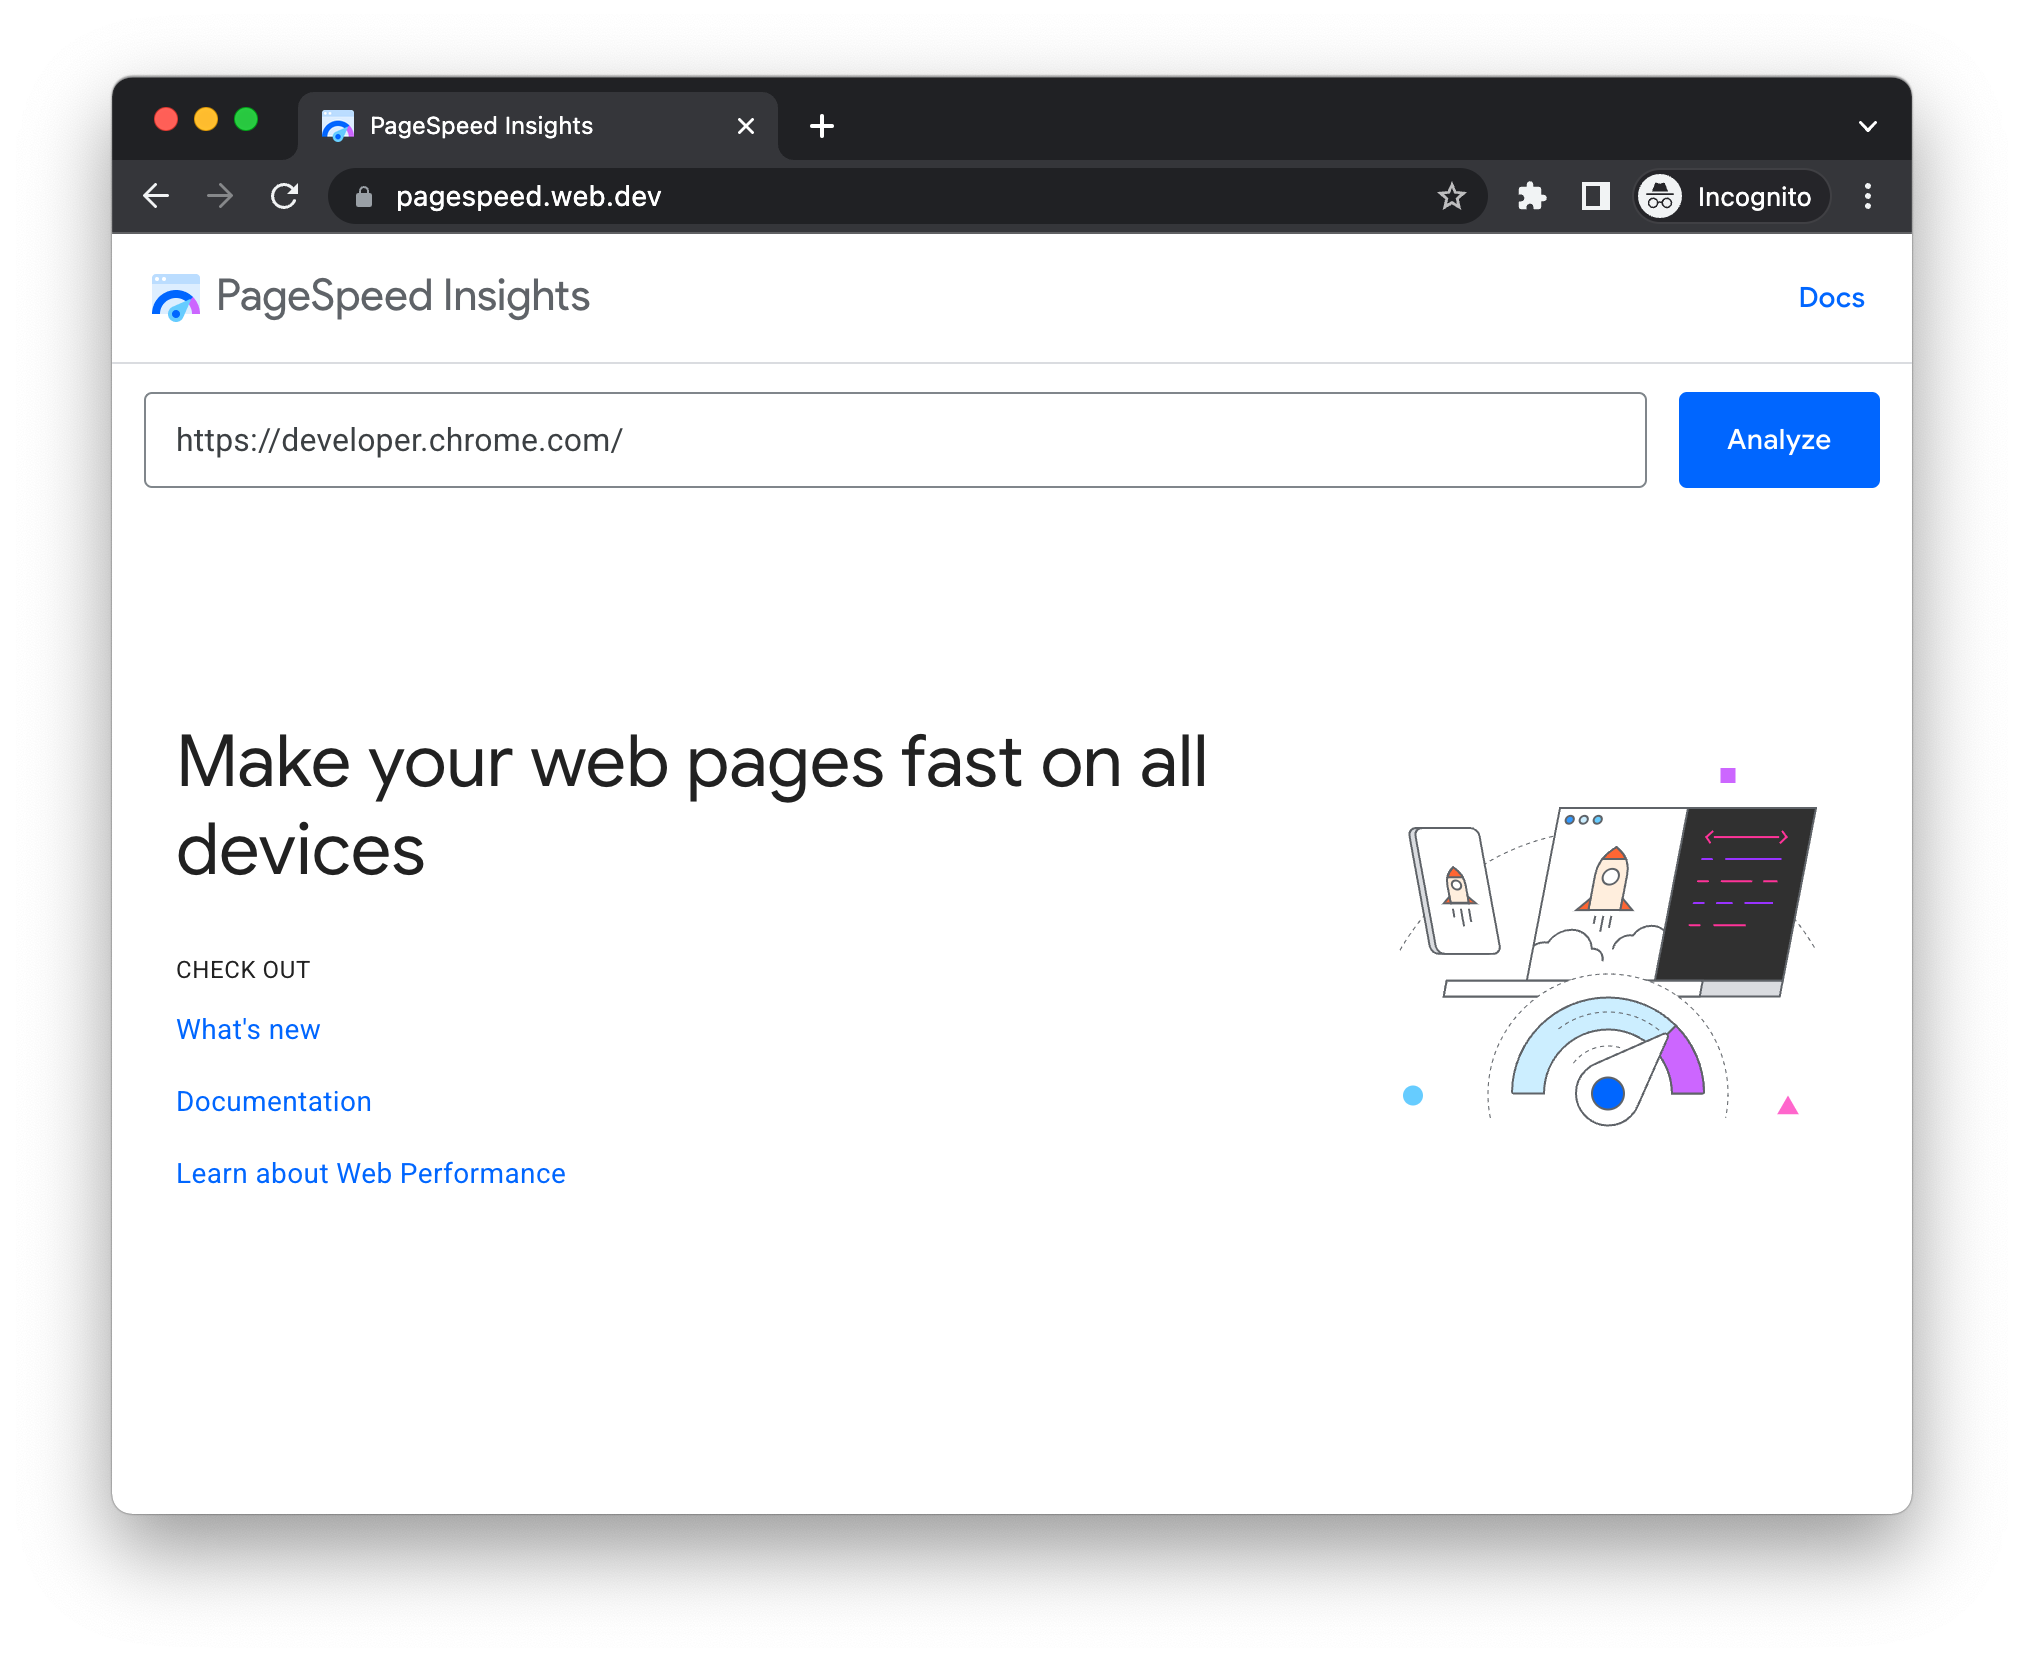
- Firstly, navigate to PageSpeed Insights to access the official app page
- Secondly, enter a preferable web-based page URL that you want to run a test for
- And then, thereafter, just click the ‘Analyze‘ button to get started
To see this in action, below is a sample illustration image of the PageSpeed Insights (by the WebDev team) toolkit at work.
Step #3: Run Google Lighthouse As A Web Browser Extension
To Install The Google Chrome Extension
- Download [Google Chrome For Desktop][desktop version].
- Install the Lighthouse Chrome Extension from the Chrome Webstore or Firefox [desktop version].
Caution: Unless you have a specific reason, try to use the Chrome DevTools workflow rather than this Chrome Extension workflow. The DevTools workflow allows for testing local sites and authenticated pages, while the extension doesn’t.
To run an audit:
- In Chrome, go to the page you want to audit.
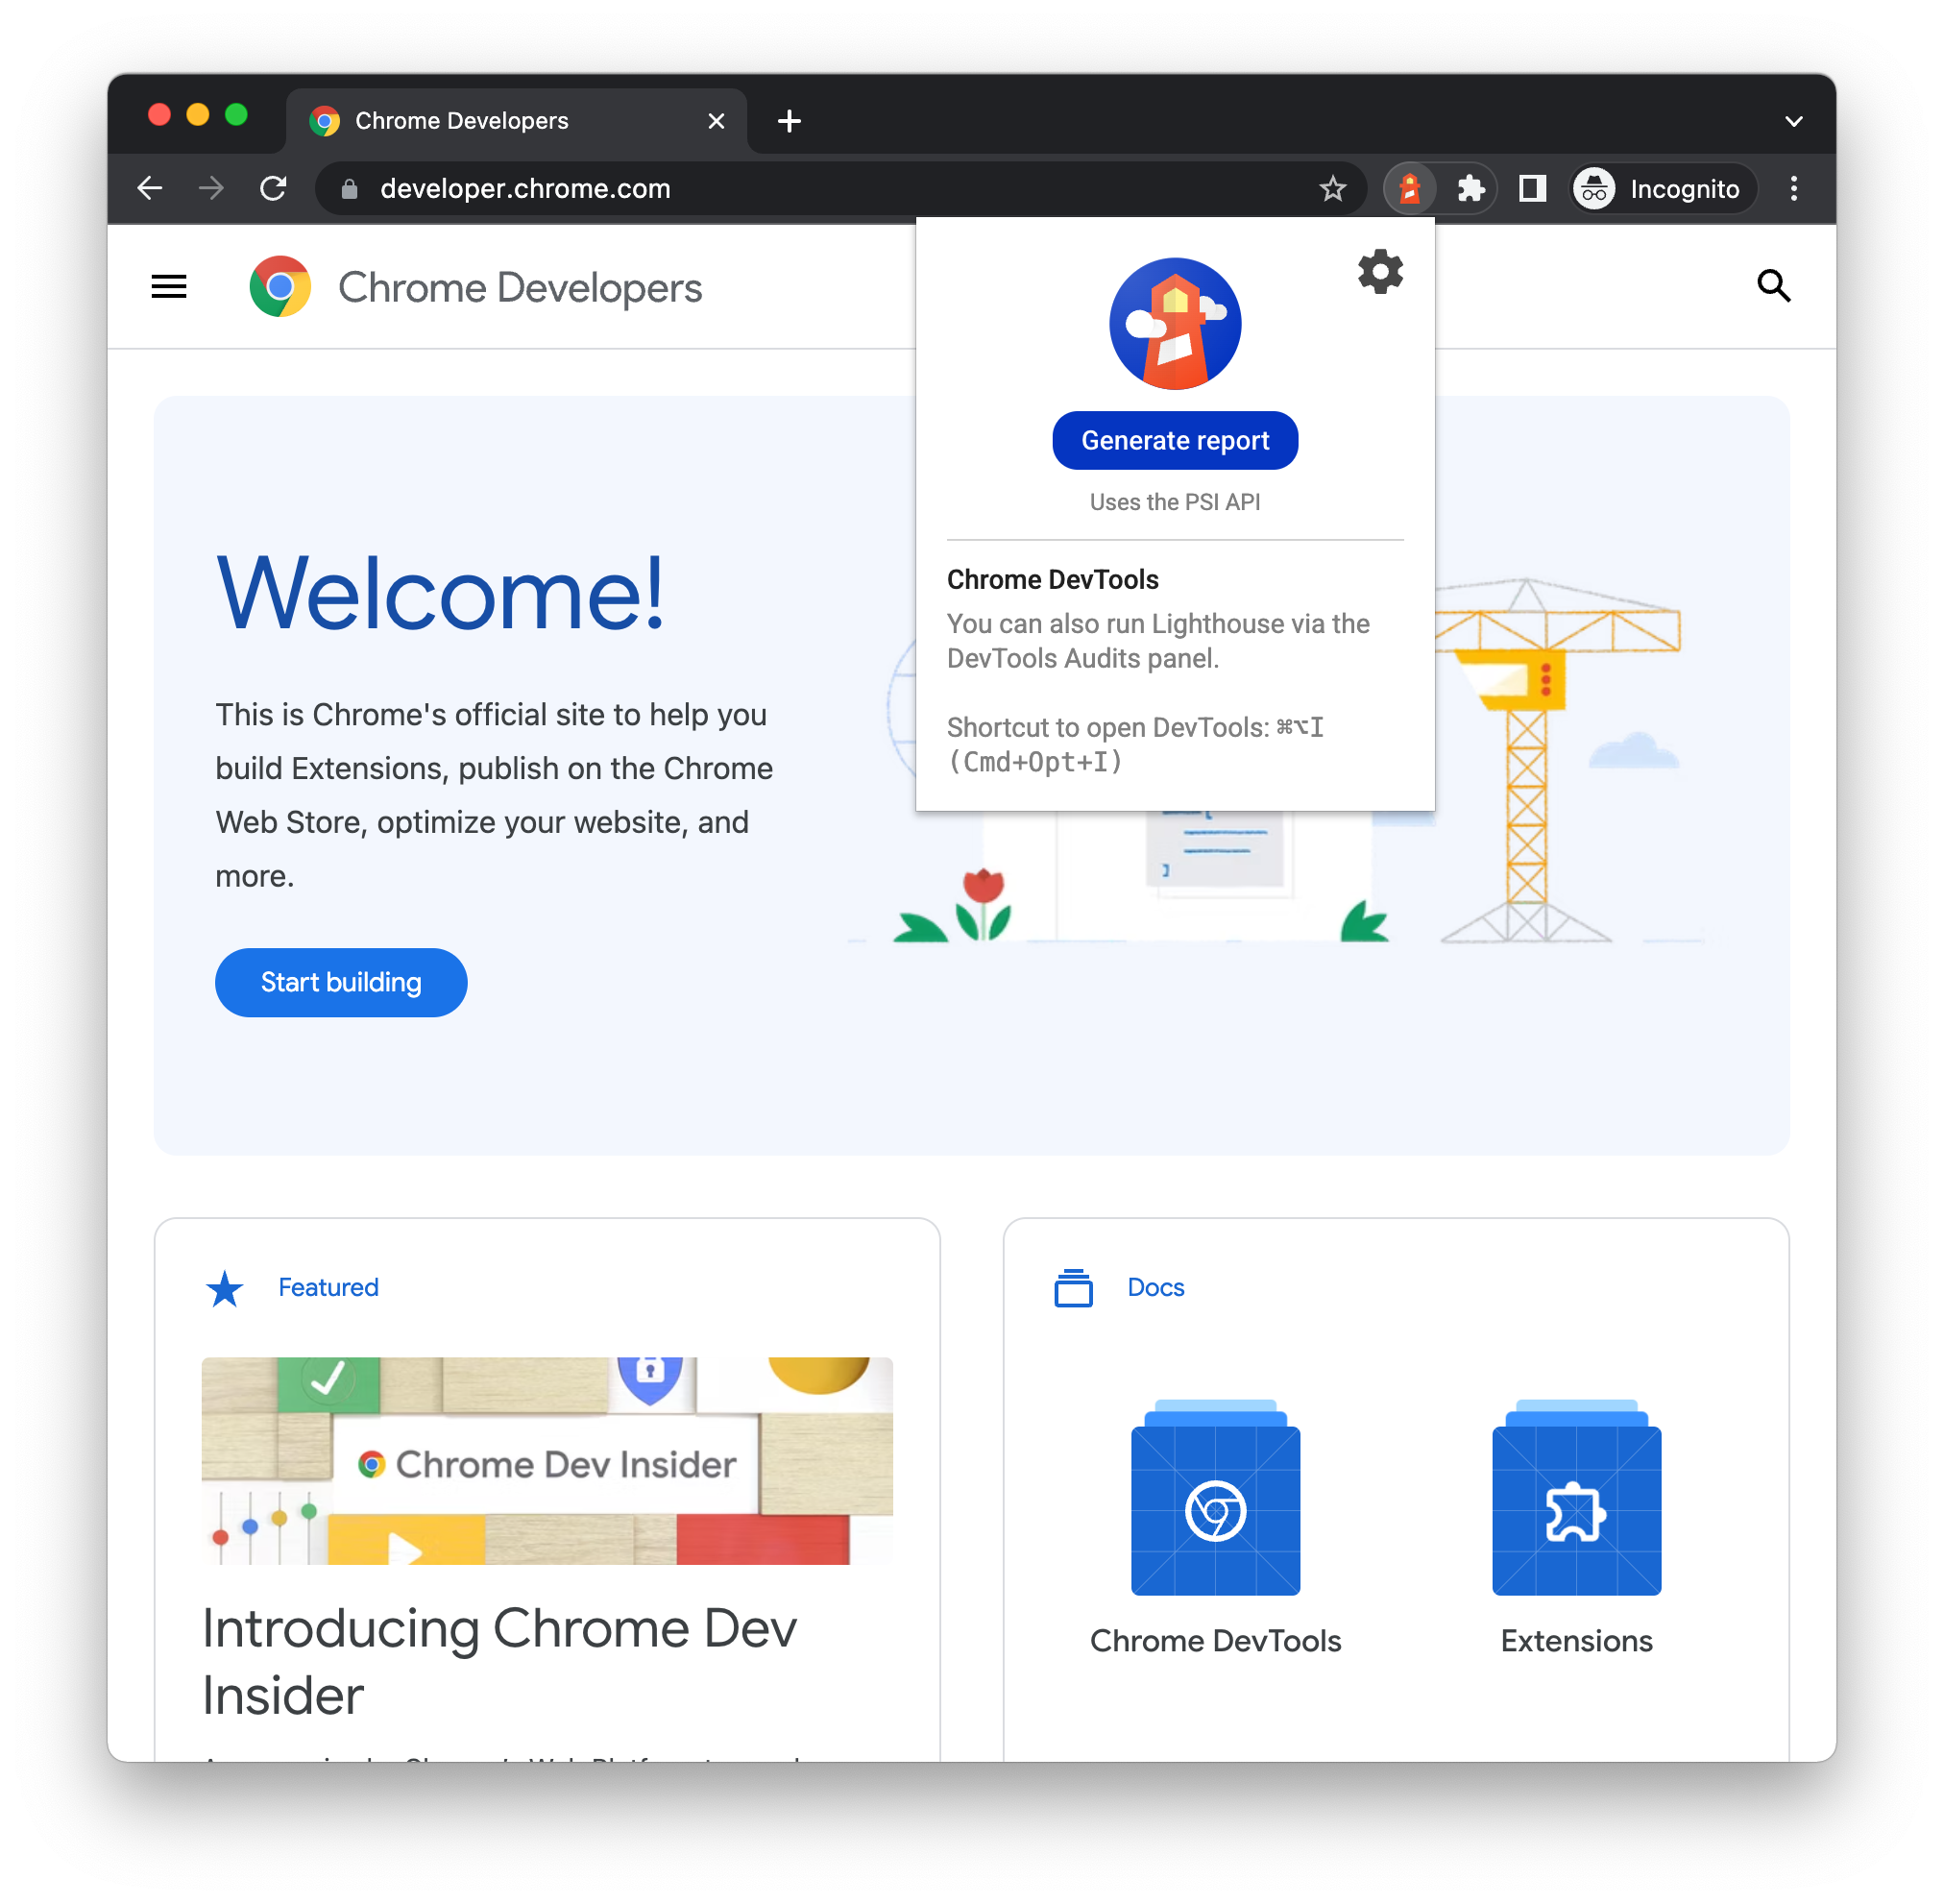
- Click the Google
Lighthouse Icon. It should be next to the Chrome address bar. If not, open Chrome’s extension menu and access it from there. After clicking, the Lighthouse menu expands and it will be as shown below:
- Thereafter, click on the Generate Report option to initialize the process.
As a result, you’ll notice that Lighthouse runs its audits against the currently-focused page. And then, it opens up a new tab with a report of the results.
Pro Tip #1: How to share and view reports online
For your information, it also offers you a way to share and view reports online. Whereby, you can use the Lighthouse Viewer to view and share reports online.
Pro Tip #2: How to share reports as JSON
The Lighthouse Viewer needs the JSON output of a Lighthouse report. The list below explains how to get the JSON output, depending on what Lighthouse workflow you’re using:
- Lighthouse report. Open the top-right
menu and click
Save as JSON
- Command line. Run:
lighthouse --output json --output-path <path/for/output.json>
To view the report data:
- Open the Google Lighthouse Viewer.
- Drag the JSON file onto the viewer, or click anywhere in the Viewer to open your file navigator and select the file.
Pro Tip #3: How to share reports as GitHub Gists
If you don’t want to manually pass around JSON files, you can also share your reports as secret GitHub gists. One benefit of gists is free version control.
To export a report as a gist from the report:
- (If already on the viewer, skip this step) Open the top-right
menu, then click
Open In Viewer. The report opens in the Viewer, located at
https://googlechrome.github.io/lighthouse/viewer/. - In the Viewer, open the top-right
menu, then click
Save as Gist. The first time you do this, a popup asks permission to access your basic GitHub data and to read and write to your gists.
To export a report as a gist from the CLI version of Lighthouse, manually create a gist and copy-paste the report’s JSON output into the gist. The gist filename containing the JSON output must end in .lighthouse.report.json. See Share reports as JSON for an example of how to generate JSON output from the command line tool.
To view a report that’s been saved as a gist:
- Add
?gist=<ID>to the Viewer’s URL, where<ID>is the ID of the gist.https://googlechrome.github.io/lighthouse/viewer/?gist= - Open the Google Lighthouse Viewer, and paste the URL of a gist into it.
Step #4: Utilize The Google Lighthouse CI
If you’re already familiar with CI and have it configured on your project already, move on to Getting Started with Lighthouse CI. It provides added value to your Continuous Integration (CI) process. If you’re unfamiliar with continuous integration or haven’t set it up on a project before, this document will define how to get started with various CI providers.
The Continuous Integration (CI) Concept
”This is a software development practice where members of a team integrate their work frequently, usually, each person integrates at least daily — leading to multiple integrations per day. Each integration is verified by an automated build (including tests) to detect integration errors as quickly as possible” — Martin Fowler.
So, CI is all about making small, frequent changes to a codebase and automatically testing those changes to ensure you always have a working build. Whereby, Lighthouse CI helps make Lighthouse a part of the automated testing process.
The Continuous Delivery (CD) Concept
”Talking about Continuous Delivery (CD), this is a software development discipline where you build software in such a way that the software can be released to production at any time” — Martin Fowler.
As a closely related practice to CI - continuous delivery is running Lighthouse within your continuous integration process. And, as a result, you can more confidently release to production. So, who is a CI Provider in this case? Well, a vendor that provides hosted services and version control integrations to facilitate automated testing for continuous integration.
Useful Guides:
Above is just a few common providers’ documentation guides on how to get started. But, there are many CI providers out there to choose from. Whilst, bearing in mind, Lighthouse CI works with any provider that offers a stable tooling environment. More so, with a stable tooling environment for Node 16 LTS or later and other Chrome features.
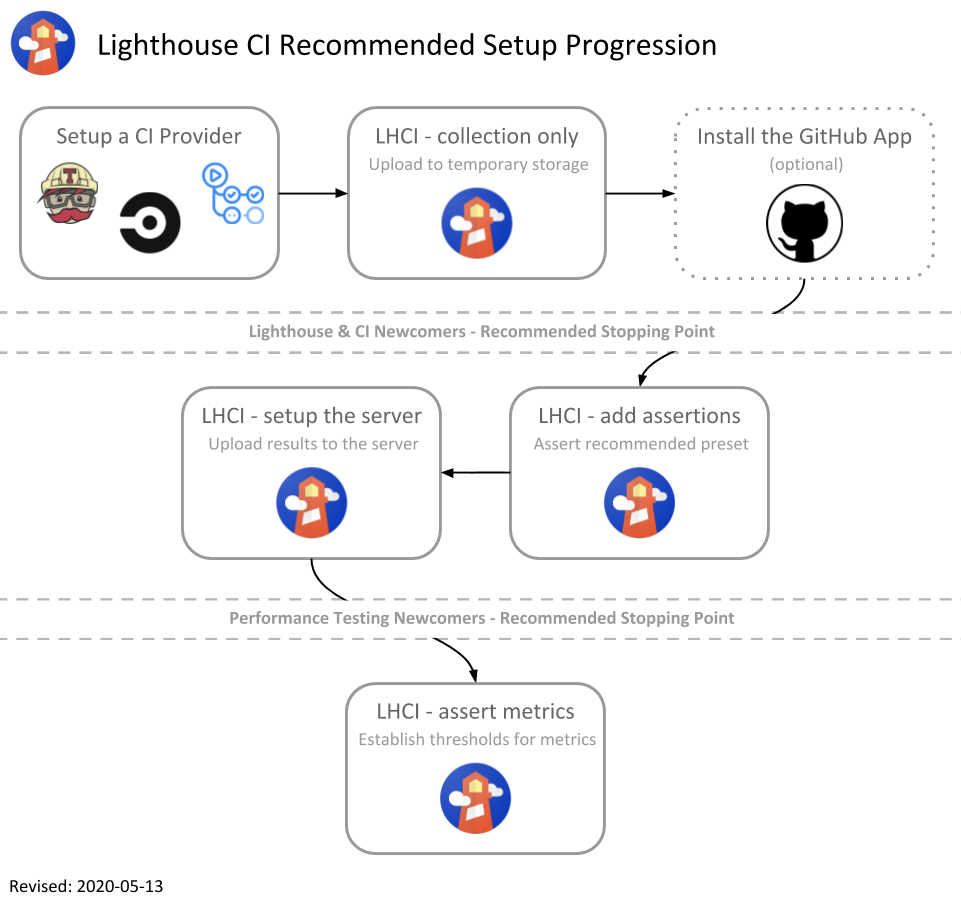
Introducing performance measurement to a project for the first time can have a fairly steep learning curve. The Lighthouse team recommends starting slowly. Refer to the diagram below for recommended stopping points based on the project’s maturity and the team’s familiarity with Lighthouse or performance measurement.
Essentially, once your team is more comfortable with Lighthouse and familiar with its results, feel free to continue on to the next stages of setup. Also, before you can move on, there are a few prerequisites you’ll need to note. Meaning, that before starting, your project should meet certain webmaster-based requirements.
Consider the following:
- Source code is managed with git (GitHub, GitLab, Bitbucket, etc).
- Branches/pull requests are gated on the results of a continuous integration build process (Travis CI, CircleCI, Jenkins, AppVeyor, GitHub Actions, etc). If you aren’t using a CI provider yet, start with our Introduction to CI documentation.
- Your CI process can build your project into production assets (typically provided as an
npm run buildcommand by most modern JavaScript frameworks). - Your project either: A) has a command that runs a web server with production-like assets. B) is a static site.
The next thing is to How To Configure Google Lighthouse CI in full detail. While bearing in mind, a config file called lighthouserc.js at the root of your repo controls the options for Lighthouse CI. For advanced users who’d prefer to use CLI flags or keep the configuration file in another location, refer to the configuration documentation for more info.
How To Collect Your Lighthouse CI Results
In this section, we’ll configure Lighthouse CI to automatically find your project’s static assets, run Lighthouse 3 times on each HTML file, and upload the reports to temporary public storage where they’ll be accessible to anyone with the URL.
NOTE: As the name implies, this is temporary and public storage. If you’re uncomfortable with the idea of your Lighthouse reports being stored on a public URL for anyone to see, skip to the add assertions or Lighthouse CI Server steps. Please read the full terms of service and privacy policy before deciding to upload your reports.
How To Configure Lighthouse CI
A config file called lighthouserc.js at the root of your repo controls the options for Lighthouse CI. For advanced users who’d prefer to use CLI flags or keep the configuration file in another location, refer to the configuration documentation. The simple configuration file below is all you need to get started collecting Lighthouse reports for temporary public storage.
lighthouserc.js:
module.exports = {
  ci: {
    upload: {
      target: 'temporary-public-storage',
    },
  },
};
How To Configure Your CI Provider
Next, we need to configure the CI provider to run Lighthouse using the lhci autorun command. autorun will automatically execute a number of commands behind the scenes and infer sensible defaults for us. For more advanced use cases where you’d like to control the exact sequence of Lighthouse commands, refer to the configuration documentation for more on:
- GitHub Actions
- Travis CI
- Circle CI
- GitLab CI
- Jenkins (Ubuntu-based)
- Google Cloud Build
That’s it! With this in place, you’ll have Lighthouse reports collected and uploaded with links to each report on every push. Essentially, the temporary public storage provides access to individual reports. But, the temporary public storage does not provide access to historical data, report diffing, or build failures.
With that in mind, you can read on to find out how to add assertions, configure the Lighthouse CI Server for report diffs and time-series charts, and enable GitHub Status Checks in full detail.
Do Modifications For Sites Without A Build Step
If your site does not use a package.json-based build step, you might receive strange error messages in the build logs of the above. If your site is static and doesn’t require a build step, you’ll need to make 2 changes to the configurations above.
On one hand, you can modify lighthouserc.js to configure the location of your HTML files using the staticDistDir property. If your HTML files are located in the root of your repo, just use ./.
module.exports = {
  ci: {
    collect: {
      staticDistDir: './',
    },
    upload: {
      target: 'temporary-public-storage',
    },
  },
};
On the other hand, you can also modify your CI provider’s configuration to remove the npm install and npm run build commands. Usually, it’s important that you leave the npm install -g @lhci/cli step. Be that as it may, you can refer to the configuration documentation for more common examples and the options available to you.
Do Modifications For Sites With A Custom Server
If your site is not static and requires the use of a custom server, you’ll need to teach Lighthouse CI how to start your server. You can modify lighthouserc.js to configure the command used to start your server using the startServerCommand property. Basically, you’ll also need to configure the url property with the URLs that you’d like to audit.
module.exports = {
  ci: {
    collect: {
      url: ['http://localhost:3000/'],
      startServerCommand: 'rails server -e production',
    },
    upload: {
      target: 'temporary-public-storage',
    },
  },
};
That said, you can refer to the configuration documentation for more common examples and the options available to you.
How To Utilize GitHub Status Checks For CI
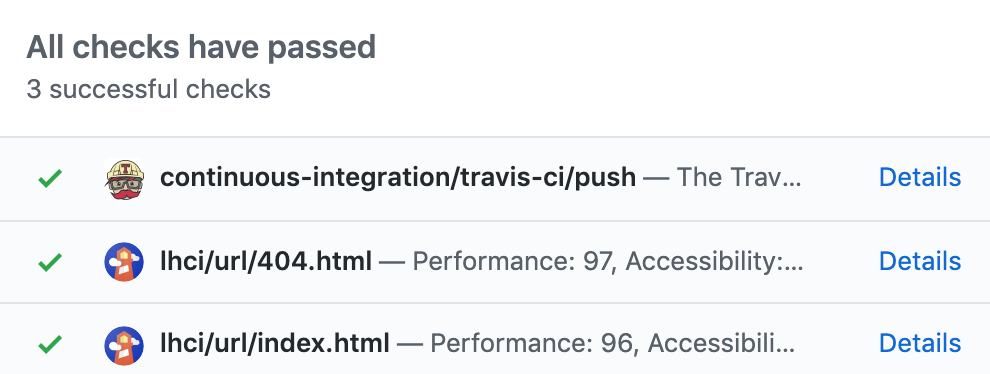
The setup so far will run Lighthouse through your CI provider, but there’s no differentiation between the build failing because of Lighthouse CI compared to your other tests. Lighthouse Links reports are also tucked away in your build logs. The status checks add extra granularity to your build reporting and direct links to uploaded reports within the GitHub UI!
Note that: Before installing the GitHub App, you should make sure that you refer to the terms of service to gather more useful GitHub webmaster information and directions first.
Use The GitHub Application Method (Recommended)
By all means, to enable GitHub status checks via the official GitHub app, install and authorize the app with the owner of the target repo. If the repo is within an organization, organization approval might be necessary. Copy the app token provided on the authorization confirmation page and add it to your build environment as LHCI_GITHUB_APP_TOKEN.
Eventually, the next time your lhci autorun command runs, it will also set the results as GitHub status checks! Of course, yes, be sure to keep this token secret. For one thing, anyone in possession of this token will be able to set status checks on your repository.
Use The Alternative Method For Personal Access Token
Moving on, if you don’t want to use the GitHub App, you can also enable this via a personal access token. The only difference is that your user account (and its avatar) will post a status check. Just make sure that you create a personal access token with the repo:status scope first. And then, thereafter, add it to your environment as LHCI_GITHUB_TOKEN.
Otherwise, be sure to keep this token secret. One thing is for sure, just like we aforementioned, anyone in possession of this token will be able to set status checks on your repository.
Utilize Other CI Provider GitHub Actions Setup Options
In this case, make sure you define the LHCI_GITHUB_APP_TOKEN correctly — as an environment variable on the workflow — and then again, ensure that the Git history is available too — by considering the following lines of codes.
name: CI
on: [push]
jobs:
  lhci:
    name: Lighthouse
    runs-on: ubuntu-latest
    steps:
      - uses: actions/[email protected]
        with:
          ref: ${{ github.event.pull_request.head.sha }}
      - name: Use Node.js 16.x
        uses: actions/[email protected]
        with:
          node-version: 16.x
      - name: npm install, build
        run: |
          npm install
          npm run build
      - name: run Lighthouse CI
        run: |
          npm install -g @lhci/[email protected]
          lhci autorun
        env:
          LHCI_GITHUB_APP_TOKEN: ${{ secrets.LHCI_GITHUB_APP_TOKEN }}
It’s also, important to realize, that if you’re new to performance measurement or your website has a lot of room for improvement, we recommend skipping this step for now and revisiting once your Lighthouse scores are a little higher.
Add Assertions To Your Object Configuration
While Lighthouse reports at your fingertips are great, failing the build based on the audit results is even better! Add an assert object to your configuration with the preset feature options to get started with assertions.
lighthouserc.js:
module.exports = {
  ci: {
    // ...
    assert: {
      preset: 'lighthouse:recommended',
    },
    // ...
  },
};
As you can see, the setup so far will automatically assert the Lighthouse team’s recommended set of audits, but your project might have a bit of work to do before hitting straight 100s! Fear not, the assertions are completely configurable and you can disable as many audits as you need.
To get back to passing, inspect the log output of the build and disable the audits that failed. Treat this as a burndown list of your team of issues to fix! For example, if you had the build output;
Consider the following lines of codes:
  ✘  uses-rel-preload failure for minScore assertion
       Preload key requests
       https://web.dev/uses-rel-preload
        expected: >=1
           found: 0.46
      all values: 0.46, 0.46
  ✘  uses-rel-preconnect failure for maxLength assertion
       Preconnect to required origins
       https://web.dev/uses-rel-preconnect
        expected: <=0
           found: 1
      all values: 1, 1
If you would want to change your configuration to disable those two audits, you can utilize the following line of codes;
module.exports = {
  ci: {
    // ...
    assert: {
      preset: 'lighthouse:recommended',
      assertions: {
        'uses-rel-preload': 'off',
        'uses-rel-preconnect': 'off',
      },
    },
    // ...
  },
};
You can read more about what’s possible in configuration with the right assertions format guide that has more details.
How To Work Out The CI Server
In reality, just like we aforementioned, the Lighthouse CI Server is an open-source node server that can be set up on AWS, GCP, Heroku, or even your local machine. Think of the Lighthouse CI Server as your personal storage and visualization center for the history of Lighthouse reports in your project.
You can use the CI server to…
- Store Lighthouse reports for more than a few days
- Keep Lighthouse reports private on your infrastructure
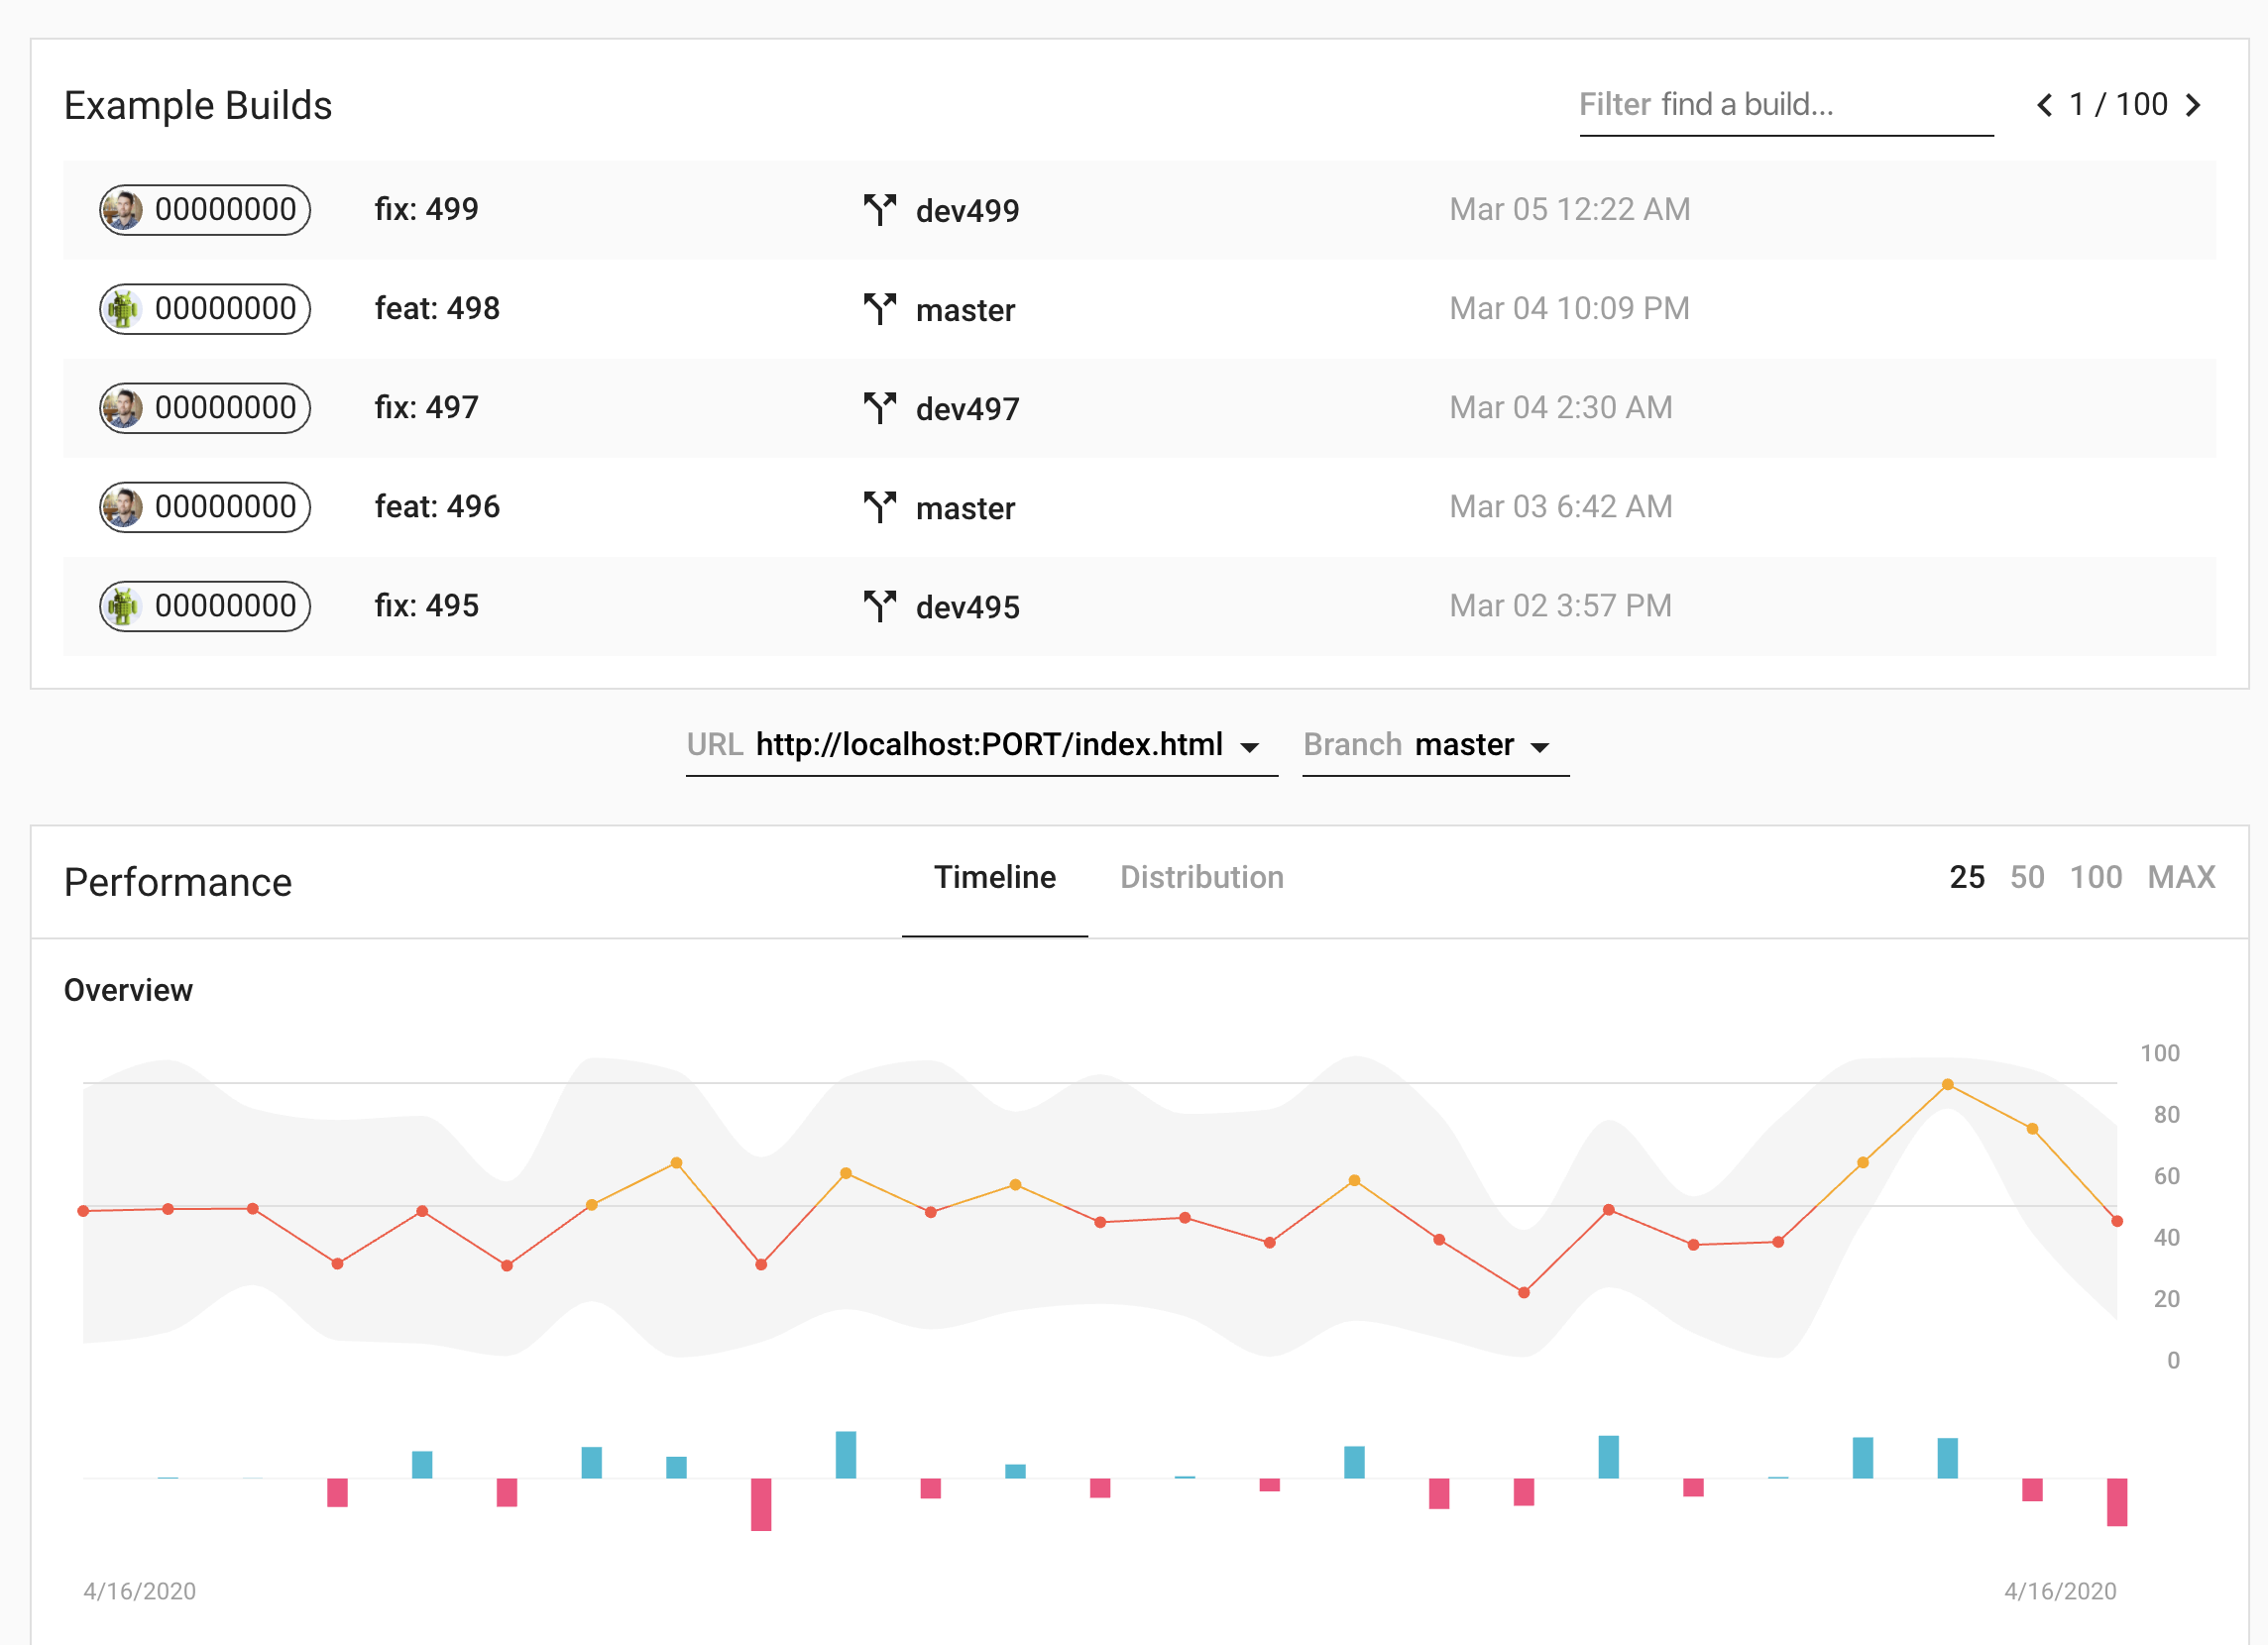
- Generate graphs of improved category scores over time to impress your boss
- Identify regressions in category score or metric performance to specific commits
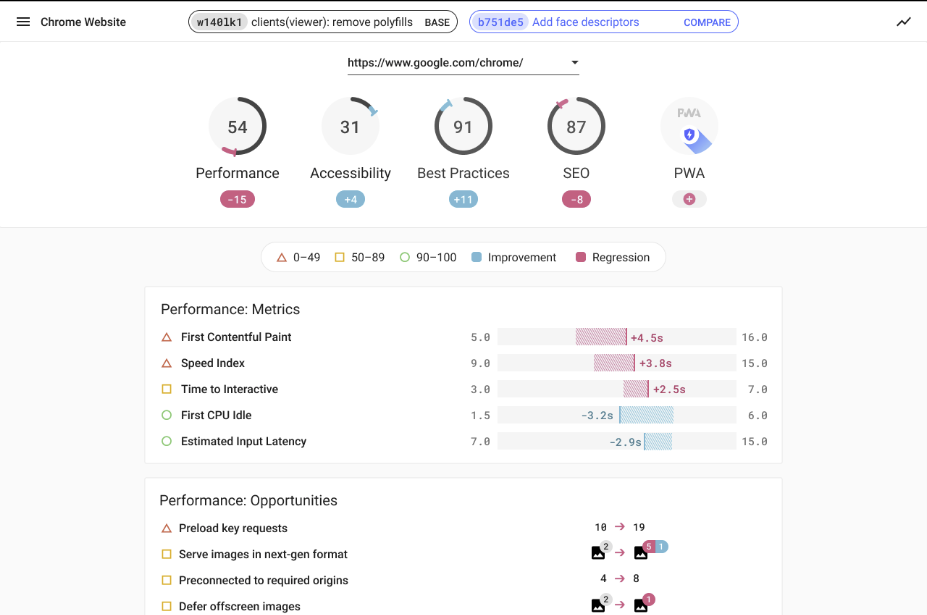
- View detailed diffs between any two Lighthouse reports finding the root cause of a regression
The process for setting up the server involves commands across a couple of different machines and will vary depending on your specific infrastructure setup.
The Cloud Deployment Steps
To deploy the server to cloud infrastructure, refer to our deployment guides. Note that by default anyone with HTTP access to the server will be able to view and create data, see the documentation on server security to learn about security options.
The Project Creation Steps
Once the server is set up, on your local laptop or desktop, make sure you can connect to the server, install the Lighthouse wizard with npm, and create a new project.
Consider the following lines of codes:
$ curl https://your-lhci-server.example.com/version # Make sure you can connect to your server.
0.x.x
$ npm install -g @lhci/[email protected] # Install the Lighthouse CI CLI.

Installing...
$ lhci wizard # Use the wizard to create a project.
? Which wizard do you want to run? new-project
? What is the URL of your LHCI server? https://your-lhci-server.example.com/
? What would you like to name the project? My Favorite Project
? Where is the project's code hosted? https://github.com/GoogleChrome/lighthouse-ci
Created project My Favorite Project (XXXXXXXX-XXXX-XXXX-XXXX-XXXXXXXXXXXX)!
Use build token XXXXXXXX-XXXX-XXXX-XXXX-XXXXXXXXXXXX to connect.
Use admin token XXXXXXXXXXXXXXXXXXXXXXXXXXXXXXXX to manage the project.
The output should contain both a build token and an admin token. Save both of these values somewhere safe for later. The build token is used by CI to upload new data to your server.
But, it’s not really that very secret, especially, if you’d like to evaluate the performance of external contributor contributions. The admin token is used to edit or delete data within the project — always keep it a secret! Not forgetting, anyone possessing the admin token can easily delete your entire project and all of the data within it.
What’s more, if your lhci server is behind basic auth, you can provide the username and password via the --basicAuth.password and --basicAuth.username command line flags.
The LCI Configuration Steps
With your server setup and the project created, all that’s left to do is update your Lighthouse CI configuration file with the new URL and token. If you’d like to keep the token secret from contributors, you can use the LHCI_TOKEN environment variable.
That’s instead of putting the token in plain text in your code. And, as such, you can consider utilizing the following lines of codes;
lighthouserc.js
module.exports = {
  ci: {
    upload: {
      target: 'lhci',
      serverBaseUrl: 'https://your-lhci-server-url.example.com',
      token: 'Your *build token* goes here', // could also use LHCI_TOKEN variable instead
    },
  },
};
NOTE: If you run a matrix of environments in your tests, make sure you only run lhci autorun ONCE per build. The Lighthouse CI server will only accept a single upload per hash and future attempts to upload data for that hash will be rejected.
How To Also Monitor Your Page Performance Score With GTmetrix
Alternatively, you can also make use of GTmetrix to see how your overall website performs, reveal why it’s slow, and discover other key optimization opportunities. Be sure that all your visitors are getting consistent performance — regardless of location or device. Equally important, test your page in different countries, browsers, connection speeds, and more…
In other words, your website’s performance can make or break you at any given time without any prior warning — GTmetrix tells you how fast your website performs and helps you discover opportunities for improvement. See how your page performs in 7 global locations with their Basic (Free) Plan and 15 Premium Test Locations with GTmetrix PRO.
Not only can GTmetrix help you get your page performing optimally, but it can also ensure your website is continually performing the way you expect it to with monitoring and alerts. Best of all, you can get started for free at any time when ready! Its Basic/Free Account allows you to monitor 1 URL Daily from its default Vancouver, Canada location.
So, go ahead and kick-start your performance journey with GTmetrix Free Basic Plan to see it in full action today! And then, for more testing, increased monitoring, or mobile testing, Upgrade To GTmetrix Pro to get all that!
Summary Notes:
Of course, yes! The Core Web Vitals is here! Besides “unique and relevant content,” how you deliver it (user experience) is now playing a significant role in Google Search rankings, meaning that Google will prioritize pages with an excellent page experience. This article discusses Google Lighthouse, a neat tool designed to audit, analyze, and improve web pages’ quality.
Since Lighthouse is a free Google web-based application, it could be a great way to see your website in the way that Google might see it, and the way it would like your users to see it as well. Not to mention, knowing any recommendations come straight from the search engine giant itself. A great thing about Lighthouse is it gives you actionable insights and it’s simple to use.
In just a few clicks, you can get detailed page experience information, providing powerful insights into improving performance. Above all, with more than 3.5 billion searches a day, Google is by far the most popular search engine. So, being able to see how it views and measures your website is extremely useful. The best thing is that we have provided you with all the basics.


