Business Intelligence (BI) Dashboards play a critical role in its operations management and optimizing performance. To some extent, they contribute to the general development of business. Running a successful business is a job like any other. However, have you ever wondered what are some of the key metrics to consider to run a successful business? This question needs a detailed explanation.
Primarily to help them understand what it takes to elevate their brands to the next level. Organizations and departments can benefit from powerful business dashboards in today’s competitive world. These essential tools help visualize the critical insights you extract from your data interactively and engagingly by offering centralized access to critical KPIs. Business Dashboards are of many types.
From analytical to operational to strategic—each tracking a particular type of metrics and telling a specific data story. Still, they can focus on individual department tasks and how they perform or provide a big picture of the current status of overall activities. By all means, these modern application tools enhance collaboration and improve communication between your team and business units.
A suitable software offers easy and centralized access to all the critical metrics you need to understand your business and react to unexpected events. With that in mind, this blog post explores how to use dashboards to boost your performance! But before we get there, we need to understand what business intelligence dashboards are and how they can impact your company’s success.
Why Business Intelligence (BI) Dashboards Matters In Optimizing The Performance
To enumerate, Business Intelligence (BI) Dashboards are a simple graphical representation that showcases all your essential company metrics. On that note, you can consider these dashboards as project management tools and software applications that help track all the Key Performance Indicators (KPIs) within the organization setup and any other relevant data values that need to be considered.
State-of-the-art business intelligence and dashboard software are essential in the KPI process. Why? Because they provide the necessary features to build stunning dashboards to display crucial findings in a meaningful way. The tool is meant to help business owners monitor all the ongoing operations within the business. You can use it to visualize complicated sets of financial data.
Such as sales within the company and any other expenses. If you have a dashboard or report in Power BI, you don’t need to work on any calculations or deal with any mathematical element. Today, data analytics, Business Intelligence (BI), and innovative application dashboards are becoming indispensable tools for businesses looking to upscale their performance and reach more profits.
With all the information you must gather, monitor, and analyze in today’s digital age, you may wonder if you are getting the most out of your data. In that case, you’ll need the best dashboard software to utilize all its benefits fully. A crucial first step to maximizing your insights is finding a state-of-the-art, professional dashboard software with the necessary features for your business.
How Business Intelligence (BI) Dashboards Help In Boosting The Performance
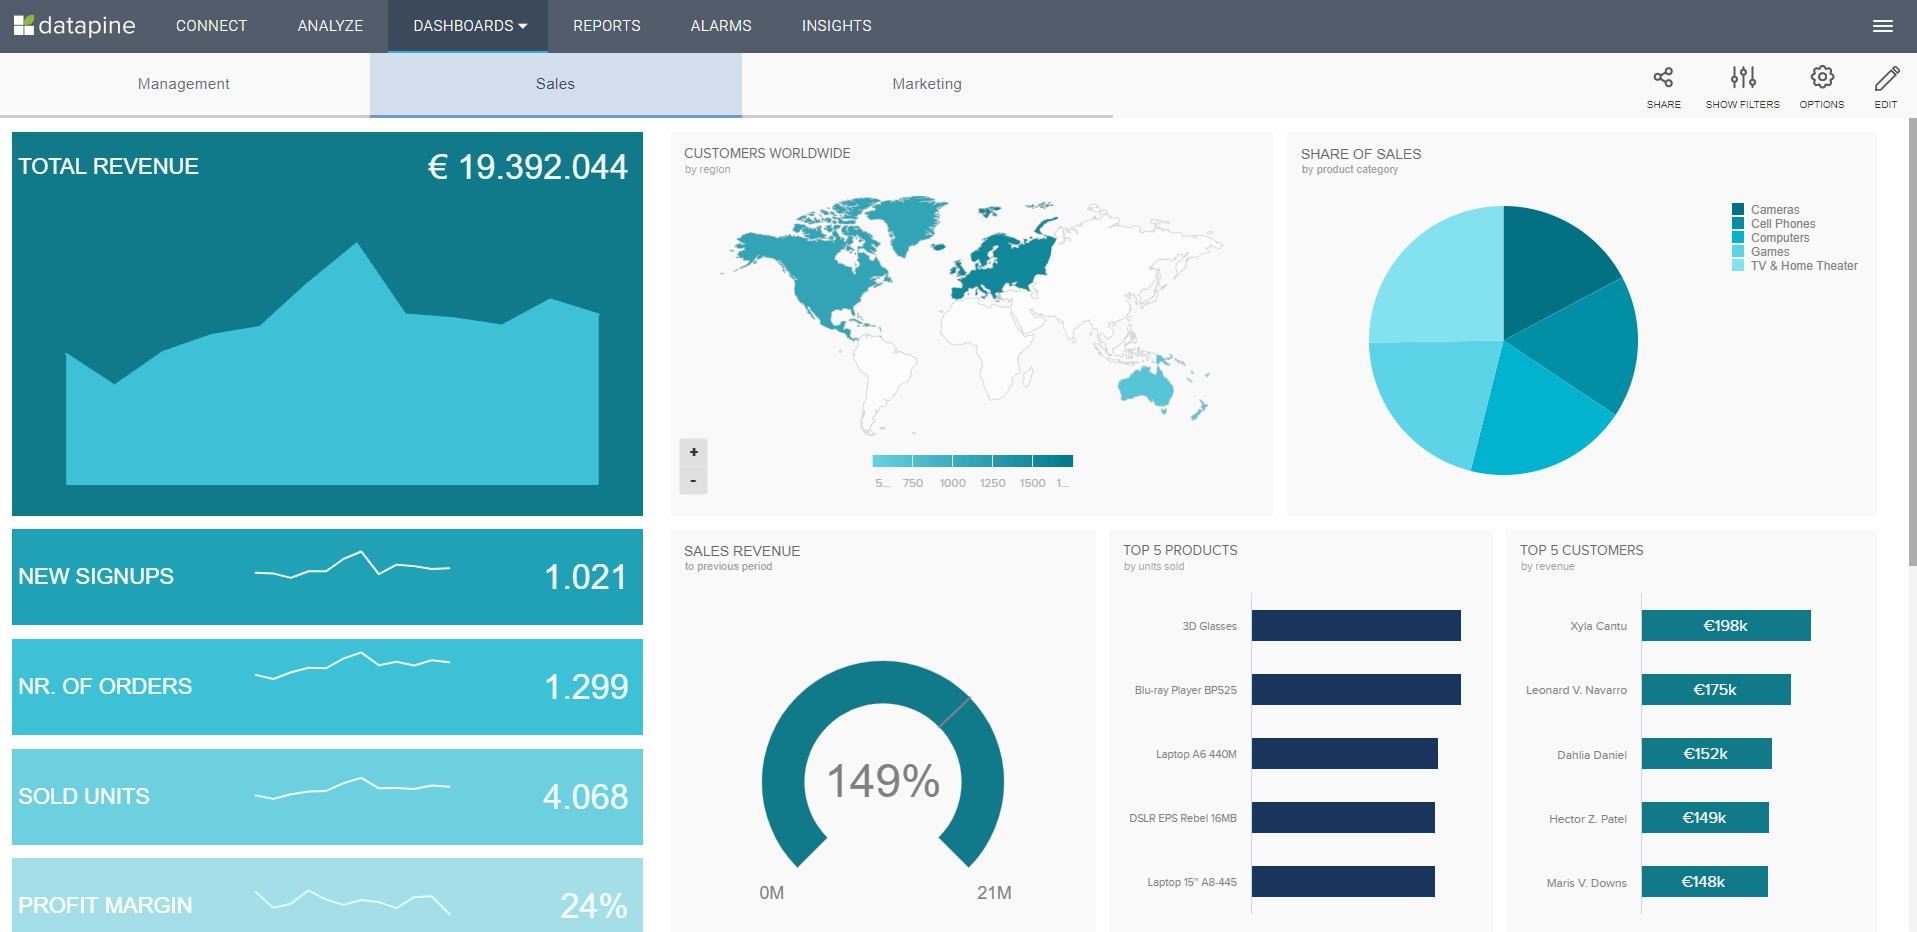
Remember, Business Intelligence (BI) Dashboard Software is an information management tool that tracks, gathers, and displays your business data in interactive and customizable visualizations. This enables its potential users, such as business managers, to monitor the health of a business, analyze processes, and provide them with actionable insights. Such an application looks something like this:
In other words, professional business dashboard software empowers anyone on your team to immediately create charts and automated reports in the shape of interactive dashboards that can be easily shared with the right decision-makers. Any team member, from the CEO to a junior manager, can discover, visualize, present, and share data in any way they deem relevant.
Whether you want to see critical customer KPIs or last month’s sales figures, the numbers you need are only a few clicks away. While these dashboarding tools have been available to upper management for years, the development of self-service solutions that anyone across the organization can use has paved the way for an unprecedented level of unlimited management access.
As a result, this helps democratize decision-making and engages every employee in the bottom line. Unfortunately, many fail to understand how to use dashboards to boost business performance. Given that many people do not know how this works, it does not mean that it’s not possible. Everything is possible, provided that you understand the basics. Below are some ways they benefit you.
1. Develop Some Good Habits
To be able to move a business forward, productivity is the key. By establishing data-driven workflows, you can minimize risks and improve your decision-making processes and overall business efficiency. Consequently, guesswork is eliminated, and employees can base decisions on the correct information at the right time. Reducing manual tasks is a critical business component.
It fosters successful business management and development and is one of the top priorities for increasing efficiency. Ask yourself: How many more tasks can you automate and free more time? Moreover, the possibility to answer urgent business questions quickly will enable you to cut even more hours while focusing on other burning questions. Focus on upscaling good habits.
According to a recent research report, businesses that evaluate their numbers are 30% more likely to perform better. Of course, you may find it difficult to assess every aspect of your business during daily operations. On that note, with a simple business dashboard, you can quickly analyze the progress of your business within the shortest time possible and extract valuable insights.
The easier it becomes to evaluate the data, the simpler it’s to fit into your tight daily schedule and attend to other critical business operations. You don’t have to waste much time manually evaluating different metrics. These are the stories of the past! As a result, you will have more time to remain productive, skyrocket your business performance and optimize operations.
2. Forecast With Actual Results
A business dashboard can easily depict the real-time performance of the business and the business plan forecast. Getting these details can help you analyze the performance of your business from different angles. The forecast section represents the things that you intend to achieve. The actuals on the dashboard are meant to help you achieve the goals that you have completed.
By checking all these activities, you will identify the areas that need quick fixing and determine the best growth routes in the future. Remember that the ultimate goal of a dashboard is to generate a concise picture of all the operations across the business. All your key performance indicators become visible from a centralized location, formed on a single screen, no matter the data source.
Seamlessly, you can easily connect flat files, CRM- and ERP data, databases, helpdesk, social media, and many more, providing instant access to all the business information you might gather and need to analyze. That way, as a non-technical user, you can fully explore your datasets with the help of a KPI Dashboard and obtain a consistent, unified view of your business metrics.
3. Stand Out From Competitors
In recent years, dashboard programs have evolved into scalable SaaS solutions that offer access from anywhere and anytime. The only requirement is an Internet connection; the tool is immediately available. Many layers of security will enable you to safely explore your data, no matter where you’re located or if you use a laptop, a desktop computer, a tablet, or even a mobile phone.
To elevate your brand to the top of the mountain, you must prove to your customers that you are unique. By having a reliable business dashboard that assembles all the critical information, you can quickly emerge as a special option from the rest of your competitors. A dashboard allows you to work as an outstanding entrepreneur within the industry.
Rather than using your old financial report now and then, you can use the real-time data report from your dashboard to gain more insights into the progress of your business. By generating real-time visual data reports, you get an actual picture of your business performance and identify the areas that require urgent fixing.
4. Save Business Operations Time
Time is crucial for any entrepreneur who intends to achieve their objectives. When you apply the manual method to track the performance of your business, you are likely to spend a lot of time. Also, you are likely to spend even more time fixing the mistakes that you have made during the process. This is likely to affect your rate of productivity, which brings down the business.
When you automate your business dashboard in a way that it can collect data from different corners of your business, you are likely to spend less time doing the work. In addition, the dashboard enables you to collect accurate data since the final output delivered is always on point. You can also use different spreadsheet tools like Excel to create dashboards.
Provided the tool monitors your business on your behalf, you can have countless hours every month to do productive tasks within the company. In return, it becomes easier for the industry to flourish by making decisions channeled to fixing the broken lines. Take chances and avoid risks with company dashboard software that will become your most invaluable business partner.
5. Enhance Your Business Goals
On the one hand, to ensure everyone is on the same page, what you need to remember as a business owner is that you can only be successful if you understand what success looks like. Also, working with a team of professionals involves lots of aspects. On the other hand, to lead your team members in one direction, you must ensure that you are all reading on the same page.
Ensure that all your team members understand the doors to success. Running a successful business is about setting goals and tracking different metrics to help you achieve your objectives. However, if your team members need to understand your brand’s goals, you are moving in the right direction. Every member should understand the goals your business intends to achieve.
A dashboard can help you achieve this since it outlines everything clearly. Your team members can learn your company’s objectives, making working in the same direction easier. With the possibility to utilize Artificial Intelligence (AI) technology, the dashboarding software augments the traditional means by monitoring, analyzing, and generating actionable data insights.
6. Tell The Story Behind Numbers
Gone are the days of a decision-maker requesting information for a meeting that gets rescheduled, leading the report preparer to have to do the work twice. No matter when you need to look at the statement report, the charts are current. If you have a graph that tells you that your business has not attained the goals set, it will also give you numbers behind it. You will stand a better chance.
In particular, one of the chances you’ll get is to explore why things are happening as they are. The numbers will automatically tell you why things are happening the way they are in your business. Raw numbers are ineffective as they bore people, so we must start storytelling with data and visual content. A dashboard elaborates further on the existing story behind your data.
Your charts and reports are updated continuously less than a second after the action occurs. Entrepreneurs can quickly discover why things have taken a different direction in business. After uncovering the story, you can identify the best way to mitigate the situation and get the way forward. Dashboards take you to the next level of data management and strategic decision-making.
7. Everyone Can Explore Data
Back in the day, the IT department was responsible for coding the required data or generating reports that would take days, if not weeks. Modern solutions cut the middleman and provide the user with a drag-and-drop interface, enabling you to explore the data independently. As a result, this self-service approach empowers you to create and analyze your unique business dashboards.
More so without writing a single line of SQL code by selecting the desired chart and dropping it onto the required area. Your data is immediately visualized, and you don’t need to wait for the analysis for hours or days. Furthermore, some powerful online data analysis tools will do your hard work. Equally important, real-time is all the rage these days, and why shouldn’t it be?
Just think—your data is automatically updated without the tedious and error-prone practice of manually entering new information. A real-time live dashboard allows you to monitor activity throughout your business processes. This flexibility empowers users to answer business questions immediately, analyze on the go, and avoid expensive in-house IT management and maintenance.
8. Begin Trusting Your Data Results
By utilizing a modern dashboard application, users can completely trust their data since the software becomes the single point of truth, no matter the number of data sources. You can connect your data and work with a single interface if you work with flat files, CRM/ERP, databases, helpdesk, or marketing analytics. This notion is fundamental since, today, a database is vital.
Most companies gather so much data that working with different tools and software has become tedious and tiring. Ultimately, companies and people want to simplify their processes–business dashboard tools are the answer. Modern tools will instantaneously alert you if a business anomaly occurs or a specific goal is met. Hence, you can immediately prevent a business disaster.
Or rather, celebrate your newly reached goals. You can benefit from neural networks, pattern recognition, or threshold alerts that will help you spot trends and identify patterns, notifying you of significant changes even on your desktop computer, tablet, or mobile.
In Conclusion;
Every entrepreneur takes time to monitor the performance of their businesses. However, evaluating the performance of your business without proper tools and metrics is a strenuous exercise. You can relinquish this duty to a business dashboard with all the essential features you need to make your work easier. Usually, Business Intelligence (BI) Dashboards are designed to be simple.
This makes it easier to evaluate the performance of your business and deliver credible feedback. A business intelligence dashboard lets you easily and quickly deal with technical metrics to assess your business’s progress. To run a successful business, you must have a functional dashboard that delivers accurate reports. Realistically, the tool will help you attain your business objectives.
Resource Reference: How Information Management System (IMS) Drives Business Data
It will also help you optimize the general success of your business. Be that as it may, imagine that your sales team is presenting to a potential client on the verge of closing a sale when a question arises about past performance, financial efficiency, future predictions, or a host of factors. Out comes your phone or tablet; seconds later, the data is charted, providing context simultaneously.
This is just one scenario where performance data dashboard software brings added value to businesses. It would help if you had advanced business efficiency driven by powerful tools to establish yourself on the market and survive. Ultimately, the right dashboards increase organizational efficiency and create a data-driven culture that can only get positive results for the company.


