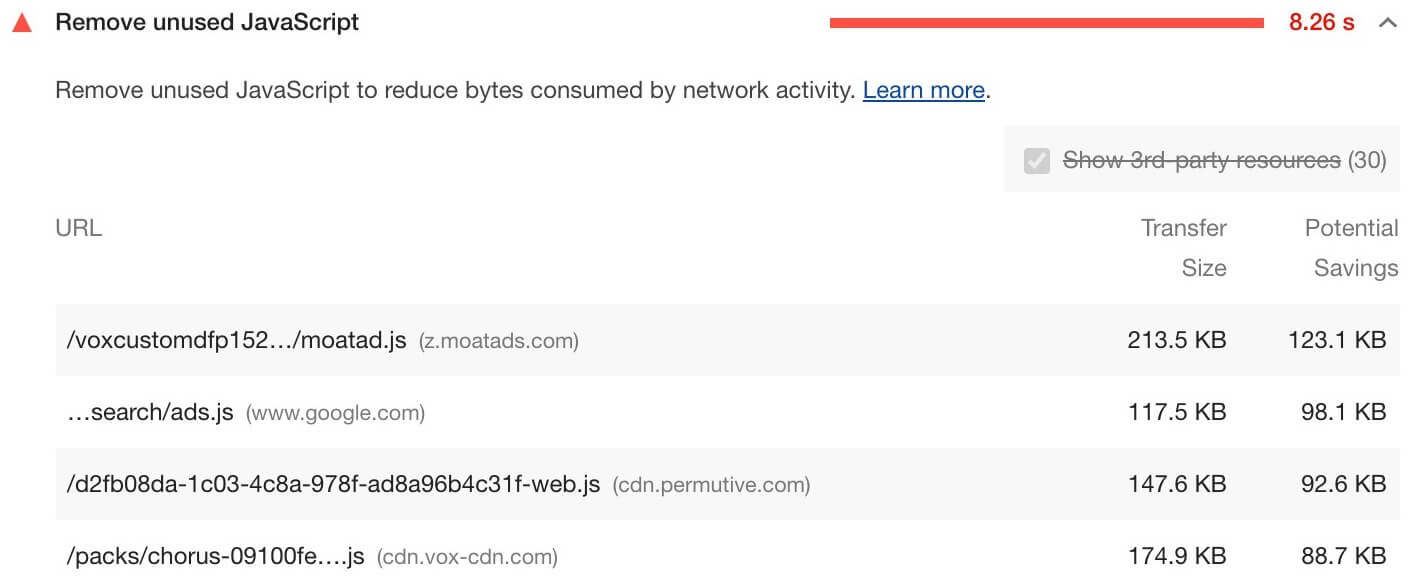
To deliver optimal performance, make your JavaScript Async and eliminate any unnecessary JavaScript from the critical rendering path. One way is to reduce any unused JavaScript and defer loading scripts until they are required to decrease the bytes consumed by network activity. Also, try to look out for plug-ins that have many scripts in the list.
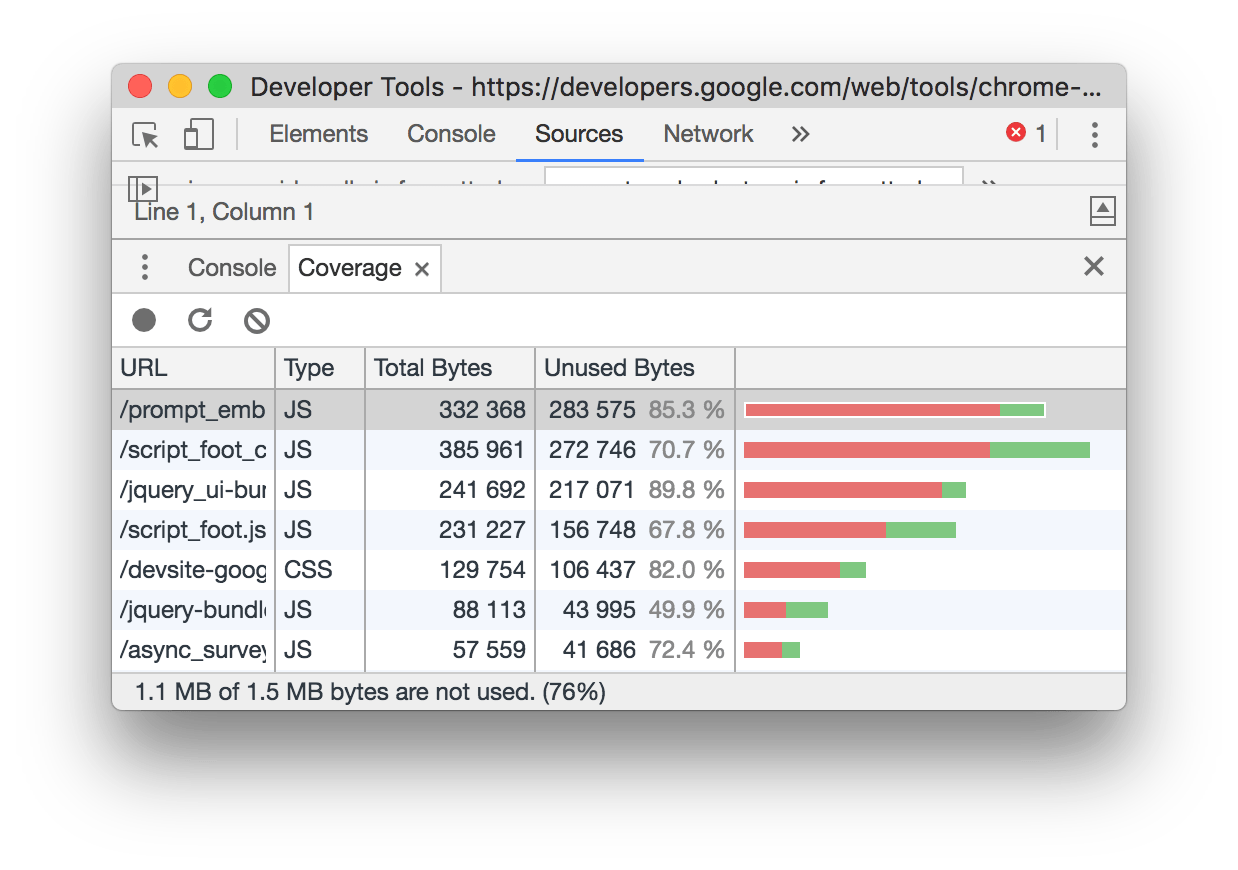
Eventually, note all those scripts which have a lot of red in code coverage. A plug-in should only enqueue a script if it is actually used on the page. More precisely, consider reducing, or switching, the number of WordPress Plugins loading unused JavaScript on your page. To identify plug-ins that are adding extraneous JS, try running code coverage in Chrome DevTools.
You can identify the theme/plug-in responsible from the URL of the script. Technically, in terms of web coding, any unused JavaScript can slow down your page load speed as well as its overall performance in a variety of ways.
Consider the following basic ways:
- If the JavaScript is render-blocking, the browser must download, parse, compile, and evaluate the script before it can proceed with all of the other work that’s needed for rendering the page.
- Even if the JavaScript is asynchronous (not render-blocking), the code competes for bandwidth with other resources while it’s downloading, which has significant performance implications. Sending unused code over the network is also wasteful for mobile users who don’t have unlimited data plans.
In general, only performance scoring metrics contribute to your Lighthouse Performance Score, not the results of Opportunities or Diagnostics. That said, improving the opportunities and diagnostics likely improve the metric values, so there is an indirect relationship. On that note, we are going to concentrate much more on JavaScript Async best practices.
How The Lighthouse Main Thread Work Audit Fails
The browser’s renderer process is what turns your code into a web page that your users can interact with. By default, the main thread of the renderer process typically handles most code: it parses the HTML and builds the DOM, parses the CSS and applies the specified styles, and parses, evaluates, and executes the JavaScript. The main thread also processes user events.
So, any time the main thread is busy doing something else, your web page may not respond to user interactions, leading to a bad experience. Lighthouse is an open-source, automated tool for improving the performance, quality, and correctness of your overall website and application platforms. When auditing a page, Lighthouse runs a barrage of tests.
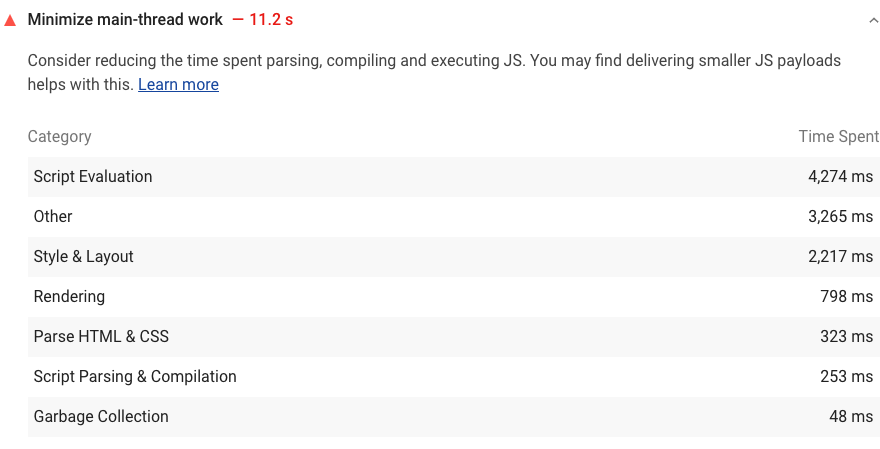
In particular, against the page and then generates a report on how well the page did. From here you can use the failing tests as indicators of what you can do to improve your app. So, if you are familiar with Lighthouse, it flags pages that keep the main thread busy for longer than 4 seconds during load. A sample illustration is shown in the image below:
To help you identify the sources of the main thread load, Lighthouse shows a breakdown of where CPU time was spent while the browser loaded your page. With that in mind, you can have a look at how to minimize main thread work in detail. Likewise, see the Lighthouse performance scoring post to learn how your page’s overall performance score is calculated.
A lot of the variability in your overall Performance score and metric values is not due to Lighthouse. When your Performance score fluctuates it’s usually because of changes in underlying conditions.
The most common problems include:
- A/B tests or changes in ads being served
- Internet traffic routing changes
- Testing on different devices, such as a high-performance desktop and a low-performance laptop
- Browser extensions that inject JavaScript and add/modify network requests
- Antivirus software
Luckily, Lighthouse’s documentation on Variability covers this in more depth. Furthermore, even though Lighthouse can provide you with a single overall Performance score, it might be more useful to think of your site performance as a distribution of scores, rather than a single number. See the introduction of User-Centric Performance Metrics to understand why.
In short, JavaScript introduces a lot of new dependencies between the DOM, the CSSOM, and JavaScript execution. This can cause the browser significant delays in processing and rendering the page on the screen:
- The location of the script in the document is significant.
- When the browser encounters a script tag, DOM construction pauses until the script finishes executing.
- JavaScript can query and modify the DOM and the CSSOM.
- JavaScript execution pauses until the CSSOM is ready.
To a large degree, “optimizing the critical rendering path” refers to understanding and optimizing the dependency graph between HTML, CSS, and JavaScript.
What JavaScript Async Is All About
The process of JavaScript Async falls under Asynchronous Programming — a technique that enables your program to start a potentially long-running task and still be able to be responsive to other events while that task runs, rather than having to wait until that task has finished. Once that task has finished, your program is presented with the expected outcome result.
The async function declaration declares an async function (also defined as expressions) where the await keywords are permitted within the function body. The async and await keywords enable asynchronous, promise-based behavior to be written in a cleaner style, avoiding the need to explicitly configure promise chains.
Realistically, JavaScript allows us to modify just about every aspect of the page: content, styling, and its response to user interaction. However, JavaScript can also block DOM construction and delay when the page is rendered. To deliver optimal performance, make your JavaScript Async and eliminate any unnecessary JavaScript from the critical rendering path.
Markedly, registries like npm have transformed the JavaScript world for the better by allowing anyone to easily download and use over half a million public packages. But, we often include libraries we’re not fully utilizing. To fix this issue, that’s why we analyze your bundle to detect unused code. And then, remove unused and unnecessary libraries.
Resource Reference: How The Google Lighthouse Performance Score Is Weighted
By removing unused code, you can improve your website’s Core Web Vitals at large. The Largest Contentful Paint, for example, can be affected by unused code by increased bandwidth contention caused by larger than necessary assets. LCP can also be affected if large JavaScript assets that render markup solely on the client contain references to LCP candidates.
Especially, by delaying when these resources can load in that cases. Other metrics such as First Input Delay (FID) and Interaction to Next Paint (INP) can also be affected by unused code. Obviously, because even unused JavaScript must be downloaded, parsed, compiled, and then executed. The unused code can introduce unnecessary delays as a result.
More so, in regard to resource load time, memory usage, and main thread activity that contribute to poor page responsiveness. This guide will help you get a handle on your project’s unused code by showing you how to analyze your project’s codebase, and offer strategies for pruning unused code from the JavaScript assets you ship to your users in production.
How The JavaScript Async Process Works
To begin with, in this article, you’ll see all the basic sections that are organized based on the categories that Lighthouse reports. You can also see The anatomy of a frame for an overview of how Chromium renders web pages. See Do less main thread work to learn how to use Chrome DevTools to investigate exactly what your main thread is doing as the page loads.
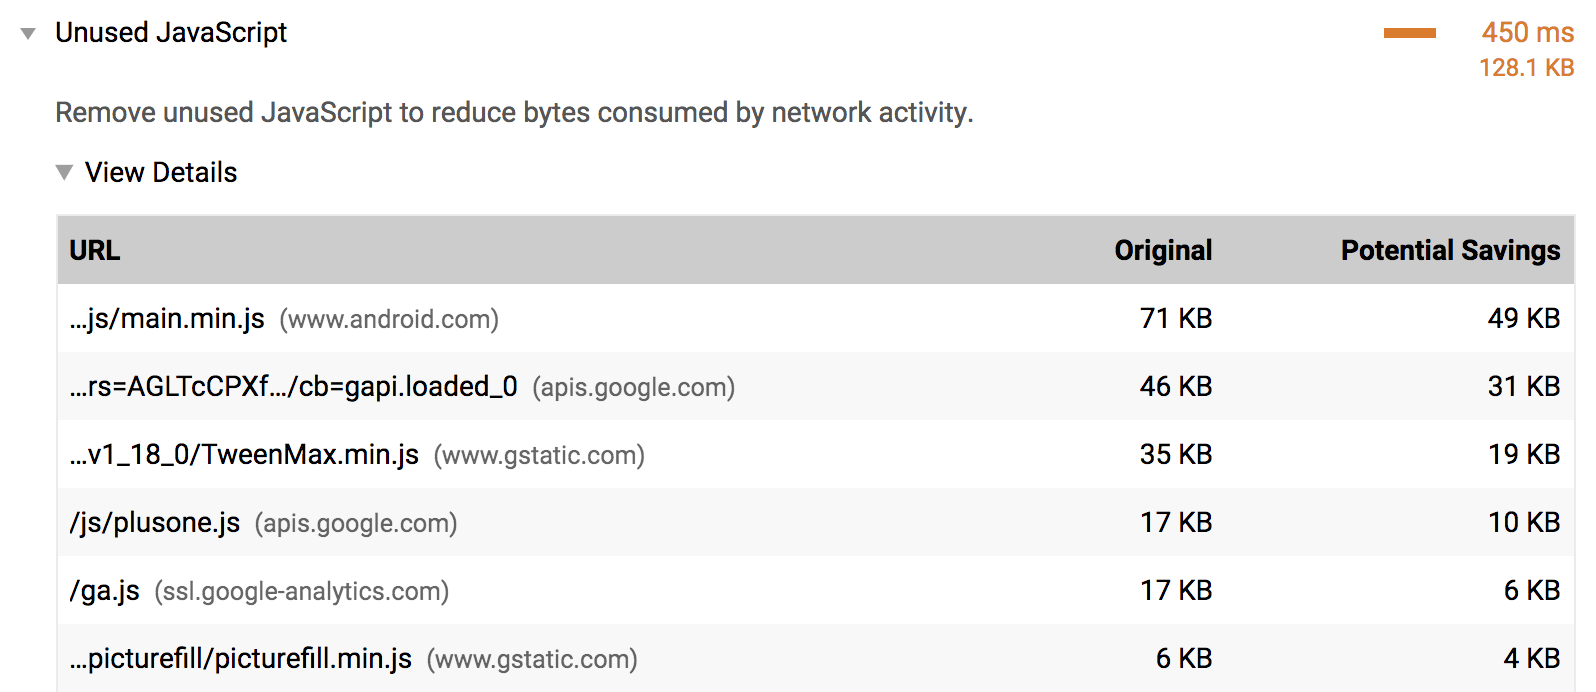
Be that as it may, as you can see from the illustration image below, during a website performance test, the Google Lighthouse Tool flags every JavaScript file with more than 20 kibibytes of unused code.
On one hand, the Coverage Tab in Chrome DevTools can give you a line-by-line breakdown of unused code. While, on the other hand, the Coverage class in Puppeteer can help you automate the process of detecting/extracting unused code.
On the same note, you can also build a tool for support in removing unused code. You can check out the following Tooling Report Tests to find out if your bundler supports features that make it easier to avoid or remove unused code.
There are tests for:
- Code Splitting
- Unused Code Elimination
- Adding interactivity with JavaScript
- Unused Imported Code
- Finding Unused JavaScript And CSS Code With The Coverage Tab In Chrome DevTools
By default, JavaScript execution is “parser blocking”: when the browser encounters a script in the document it must pause DOM construction, hand over control to the JavaScript runtime, and let the script execute before proceeding with DOM construction. Fortunately, to analyze your bundle, Google Chrome DevTools makes it easy to see the size of all network requests.
Just follow these simple steps:
- Press `Control+Shift+J` (or `Command+Option+J` on Mac) to open DevTools.
- Click the Network tab.
- Select the Disable cache checkbox.
- Reload the page.
It’s also, worth mentioning that the DevTools Coverage Tab will also tell you how much CSS and JS code in your application is unused. Perse, just to make everything here clear, a great example is illustrated in the following image:
Moving on, by specifying a full Lighthouse configuration through its Node CLI, an “Unused JavaScript” audit can also be used to trace how much-unused code is being shipped with your application.
If you happen to be using webpack as your bundler, Webpack Bundle Analyzer will help you investigate what makes up the bundle. For instance, you may include the plugin in your webpack configurations file like any other plugin.
Use these code lines:
module.exports = {
  //...
  plugins: [
    //...
    new BundleAnalyzerPlugin()
  ]
}
Although webpack is commonly used to build single-page applications, other bundlers, such as Parcel and Rollup, also have visualization tools that you can use to analyze your bundle. Reloading the application with this plugin included shows a zoomable treemap of your entire bundle.
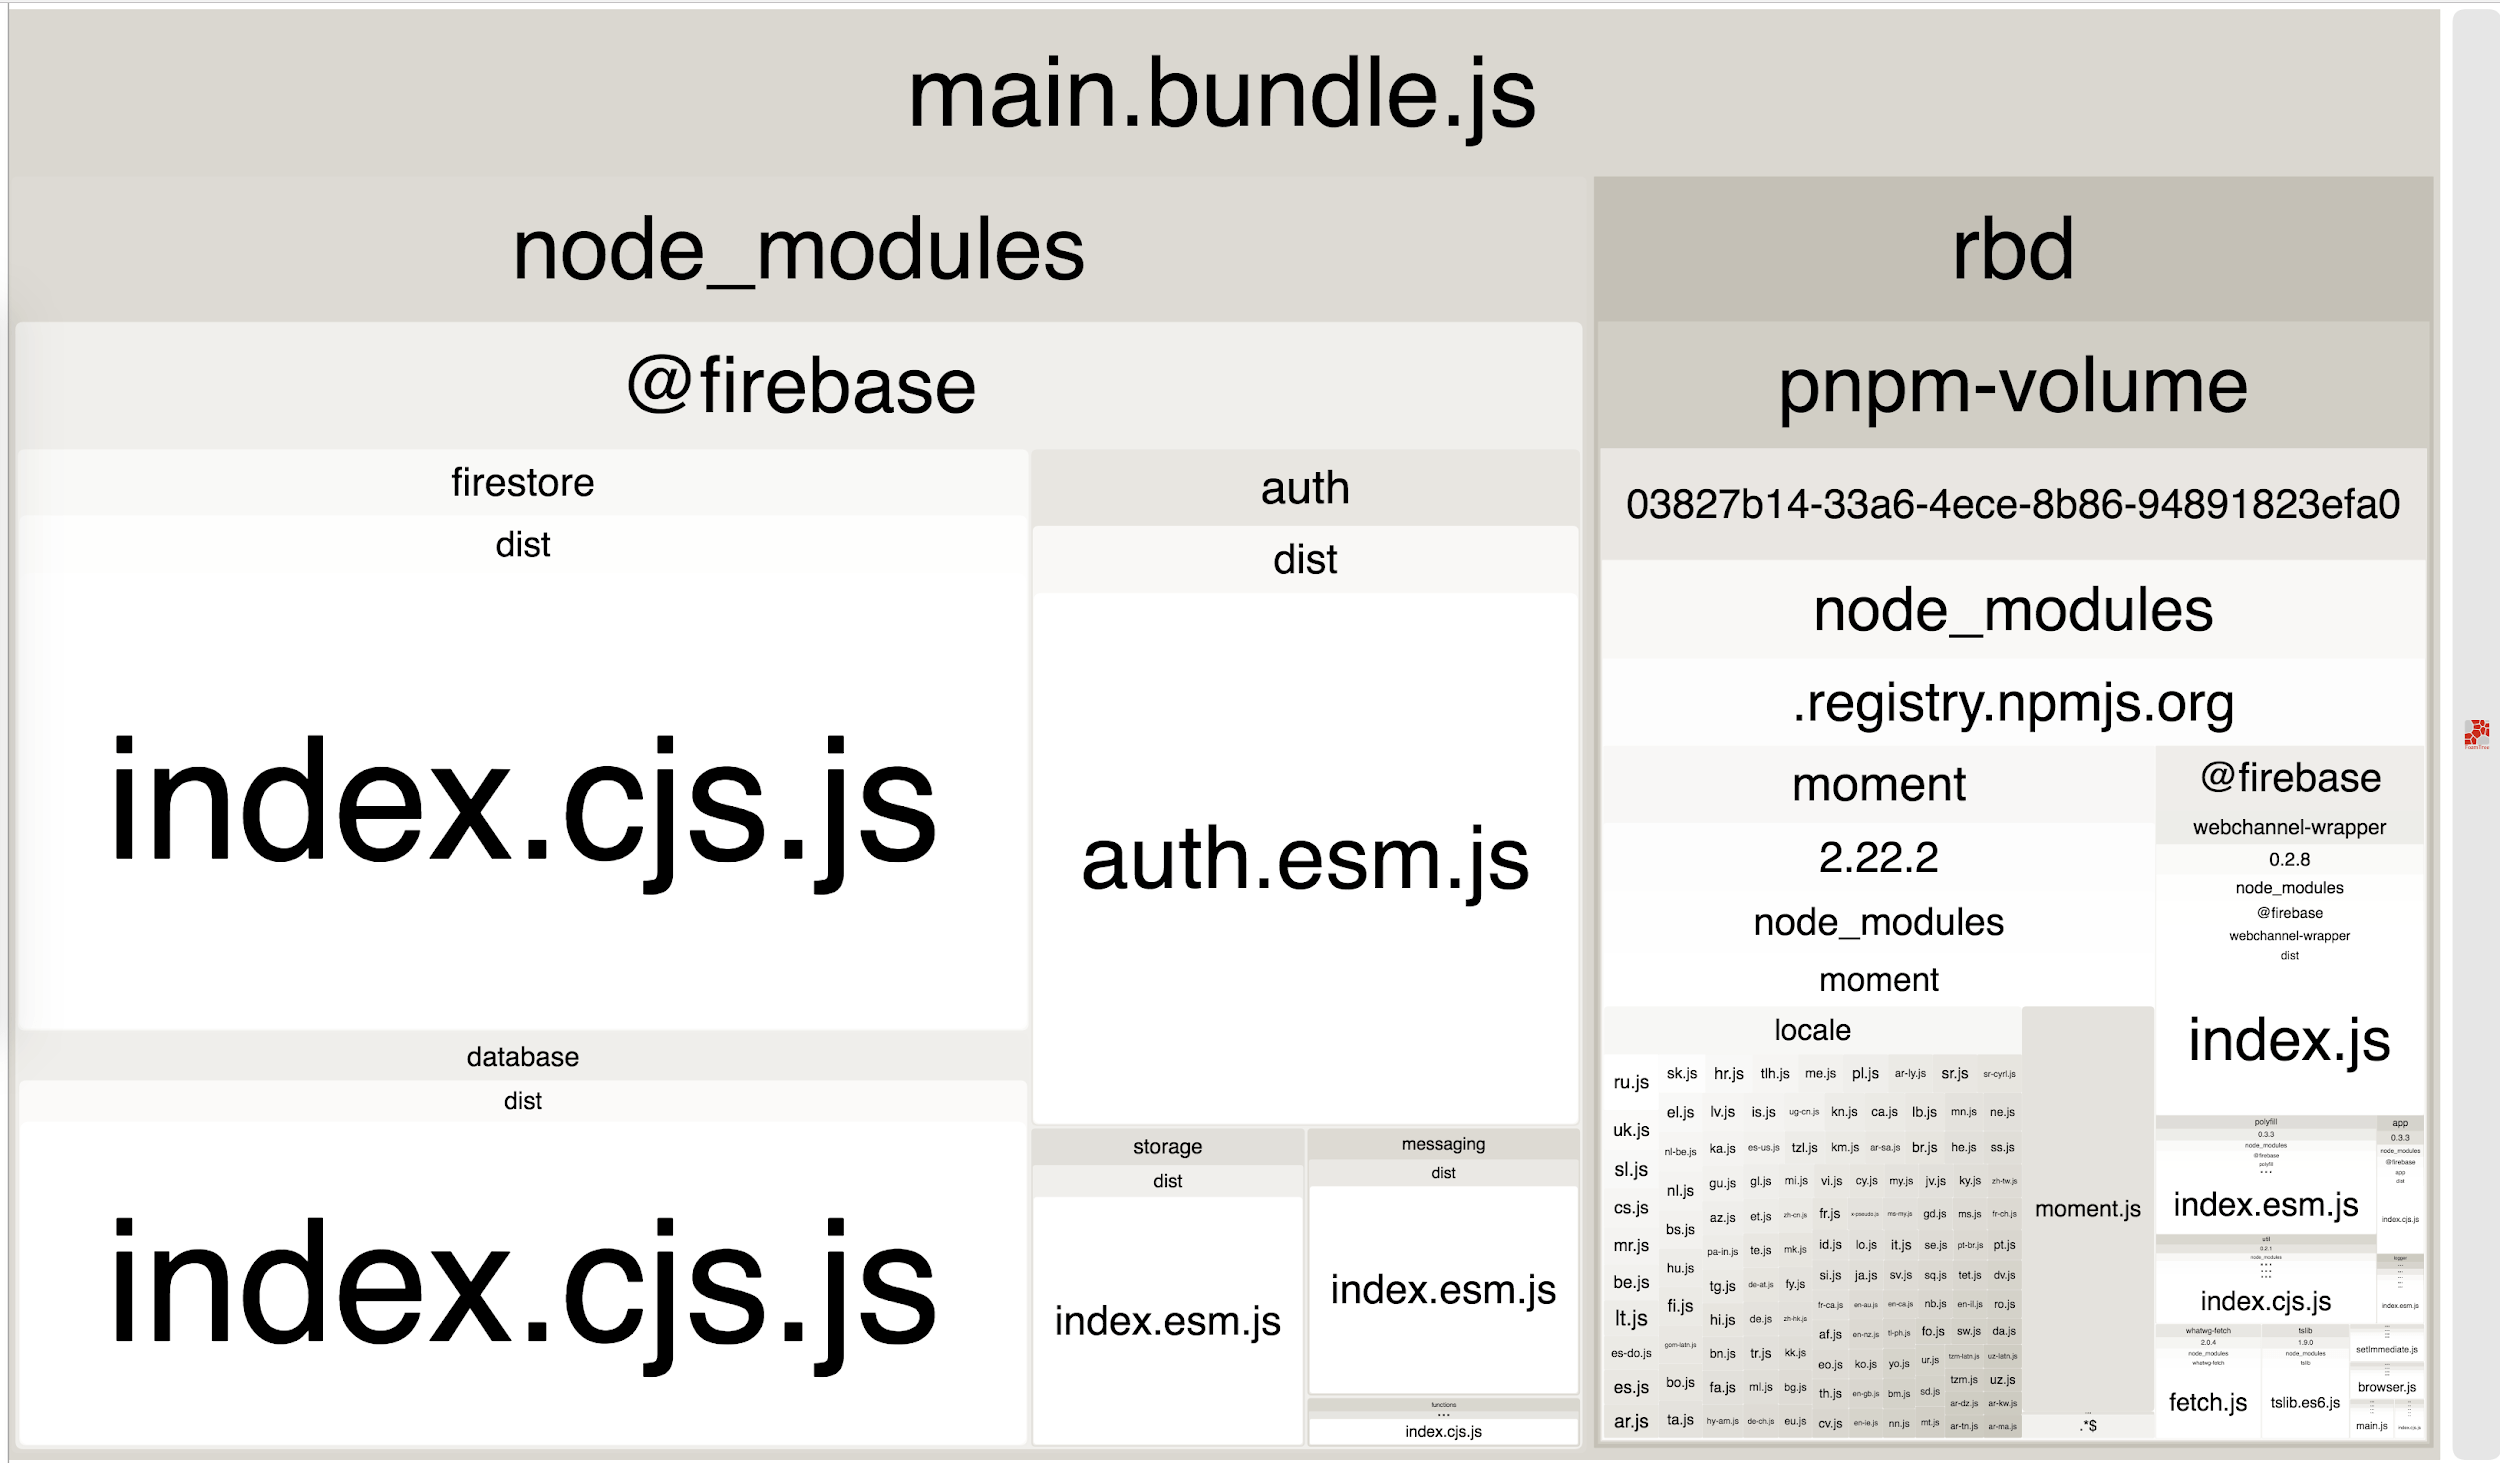
Using this visualization allows you to inspect which parts of your bundle are larger than others, as well as get a better idea of all the libraries that you’re importing. This can help identify if you are using any unused or unnecessary libraries.
How to remove unused libraries
In the previous treemap image, there are quite a few packages within a single @firebase domain. If your website only needs the firebase database component, update the imports to fetch that library:
import firebase from 'firebase';
import firebase from 'firebase/app';
import 'firebase/database';
It is important to emphasize that this process is significantly more complex for larger applications. For the mysterious-looking package that you’re quite sure is not being used anywhere, take a step back and see which of your top-level dependencies are using it. Try to find a way to only import the components that you need from it.
If you aren’t using a library, remove it. Similarly, if the library isn’t required for the initial page load, consider if it can be lazy-loaded or not. And, in case you’re using webpack, check out the list of plugins that automatically remove unused code from popular libraries for more directions.
Below are the stack-specific resources:
- WordPress: Consider reducing, or switching, the number of WordPress Plugins loading unused JavaScript on your page.
- Angular: If you are using Angular CLI, include source maps in your production build to inspect your bundles.
- Drupal: Consider removing unused JavaScript assets and only attach the needed Drupal libraries to the relevant page or component in a page. See Defining a library for details.
- Joomla: Consider reducing, or switching, the number of Joomla extensions loading unused JavaScript on your page.
- Magento: Try to disable Magento’s built-in JavaScript bundling.
- React: If you are not server-side rendering, split your JavaScript bundles with
React.lazy(). Otherwise, code-split using a third-party library such as loadable components. - Vue: If you are not server-side rendering and using the Vue router, split the bundles by lazy loading routes.
Always remember, not all libraries can be easily broken down into parts and selectively imported. In these scenarios, consider if the library could be removed entirely. Building a custom solution or leveraging a lighter alternative should always be options worth considering. However, it is important to weigh the complexity and effort required.
Particularly, for either of these efforts before removing a library entirely from an application. In a nutshell, the Performance score is a weighted average of the metric scores. Naturally, more heavily weighted metrics have a bigger effect on your overall Performance score. The metric scores are not visible in the report but are calculated under the hood.
Resource Reference: Web Testing Tools Plus A Beginner Webmaster Best Practices
Overall, the weightings are chosen to provide a balanced representation of the user’s perception of performance. However, the weightings have changed over time. Simply because the Lighthouse team is regularly doing research and gathering feedback — to understand what has the biggest impact on user-perceived performance.
Summary Notes:
Whether we use a <script> tag or an inline JavaScript snippet, you’d expect both to behave the same way. In both cases, the browser pauses and executes the script before it can process the remainder of the document. However, in the case of an external JavaScript file, the browser must pause to wait for the script to be fetched from a disk, cache, or remote server.
As a result, which can add tens to thousands of milliseconds of delay to the critical rendering path. By default, all JavaScript is parser-blocking. Because the browser does not know what the script is planning to do on the page, it assumes the worst-case scenario and blocks the parser.
A signal to the browser that the script does not need to be executed at the exact point where it’s referenced allows the browser to continue to construct the DOM and let the script execute when it is ready; for example, after the file is fetched from cache or a remote server. Adding the async keyword to the script tag tells the browser not to block DOM construction.
More so, while it waits for the script to become available, which can significantly improve performance.
